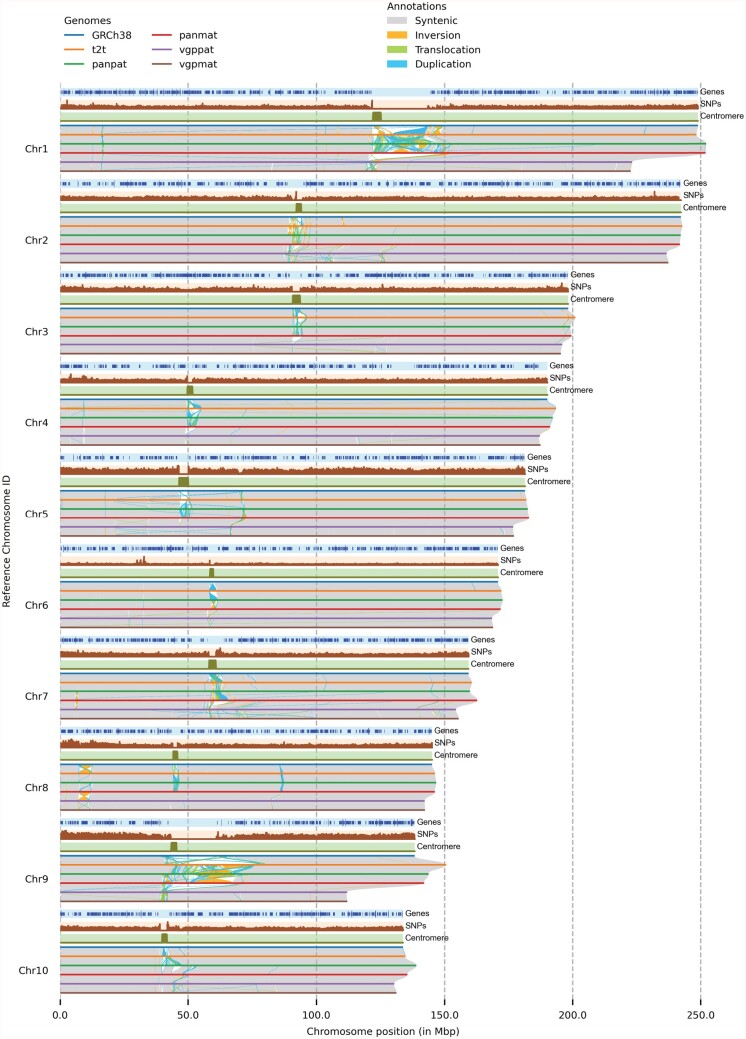
Fig. 1.
Visualizing structural rearrangements using plotsr. We used plotsr to visualize syntenic regions and structural rearrangements between 10 chromosomes from 6 human genomes. The visualization was created using plotsr without further modifications. Tracks for three genomic features: genes, number of SNPs and centromeric regions were included using optional parameters. In the genes track, smaller lines correspond to transcribed regions and longer lines represent coding-sequences (CDS)

