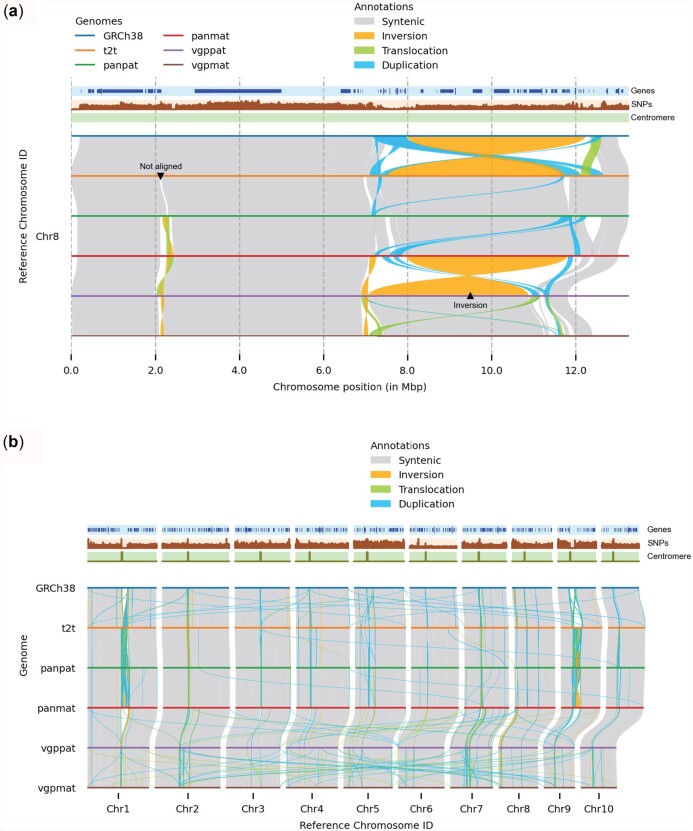
Fig. 2.
Customizing visualization using plotsr. The individual panels were created using plotsr without any further modifications. (a) Zooming in on a specific location allows for resolved visualization of the local genomic differences. Here, we visualized Chr8:1–13 000 000. Using plotsr, we have labelled a large inversion and a not-aligned region that became visible in the zoomed in view. (b) Inter-chromosomal rearrangements among the 10 chromosomes

