
Fig. 2.
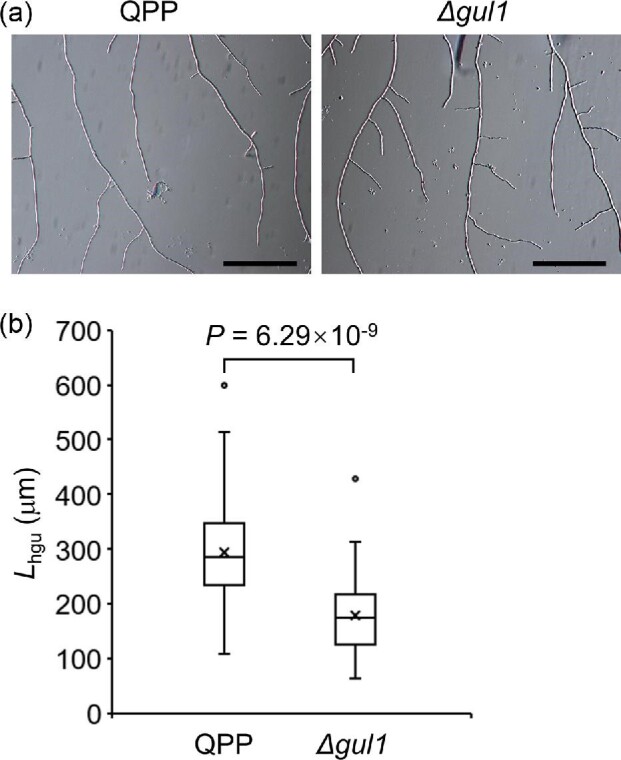
Disruption of gul1 increased hyphal branching on cellulose agar plates. Photos were taken after 24 hr of cultivation. (a) The morphology of hyphae. Scale bar, 50 μm. (b) The Lhgu values (see section Materials and Methods) quantified by measuring 50 hyphae for each strain. The cross markers indicate mean values.