Figure 8.

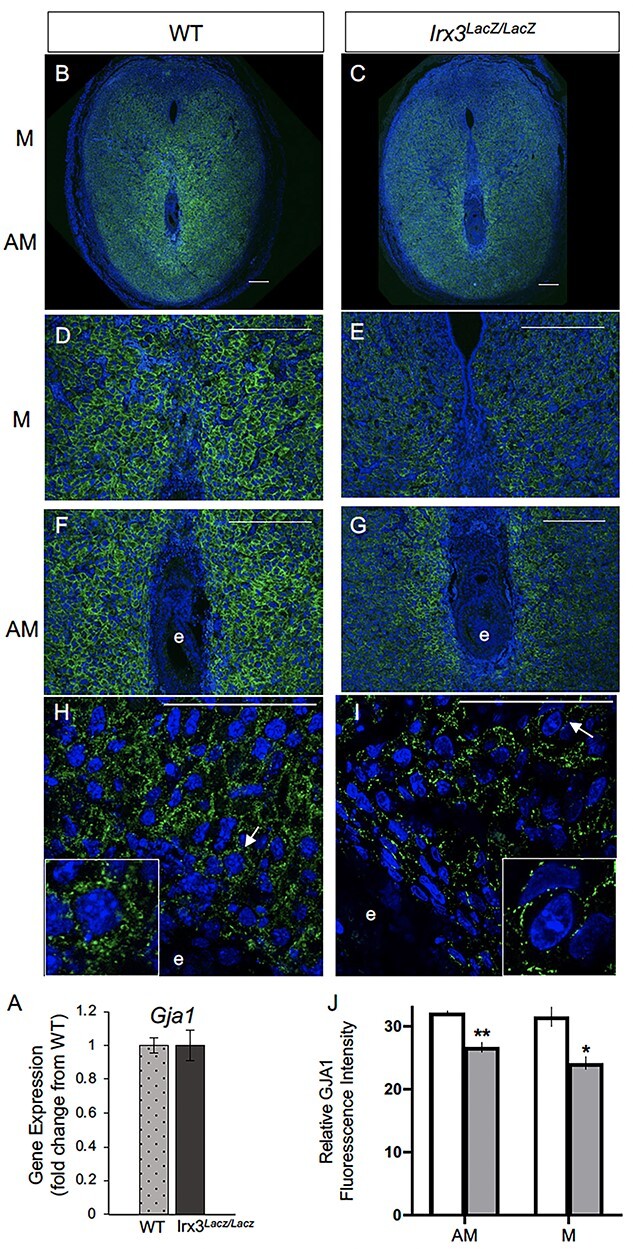
Irx3LacZ/LacZ uteri express similar Gja1 transcripts but abnormal GJA1 protein. (A) Real-time qPCR results for Gja1 from pregnant uteri of WT and Irx3LacZ/LacZ females on D7 of pregnancy. Data represent the mean ± SEM of three biological replicates performed in triplicate at each time point. Fold change was calculated relative to transcript levels of the WT sample. Statistics: Student’s t-test, *P < 0.05. (B–I) Immunofluorescence of gap junction protein 1 (GJA1, connexin 43, green) co-labeled with DAPI, a nuclear marker (blue) at gestation D7 in control (B, D, F, H, n = 4) and Irx3LacZ/LacZ (C, E, G, I, n = 5) implantation sites. Images are represented in increasing magnification, scale bars represent 250 mm. Arrows highlight single cells that are enlarged within the inset of H and I. (J) Quantification of relative GJA1 fluorescence intensity in the anti-mesometrium (AM, P = 0.01) and mesometrium (M, P = 0.027) in wild type (white bars) vs Irx3LacZ/LacZ females (light gray bars). Data represent mean ± SEM. Statistics: two-sample t-test, *: P < 0.05; **: P < 0.01.
