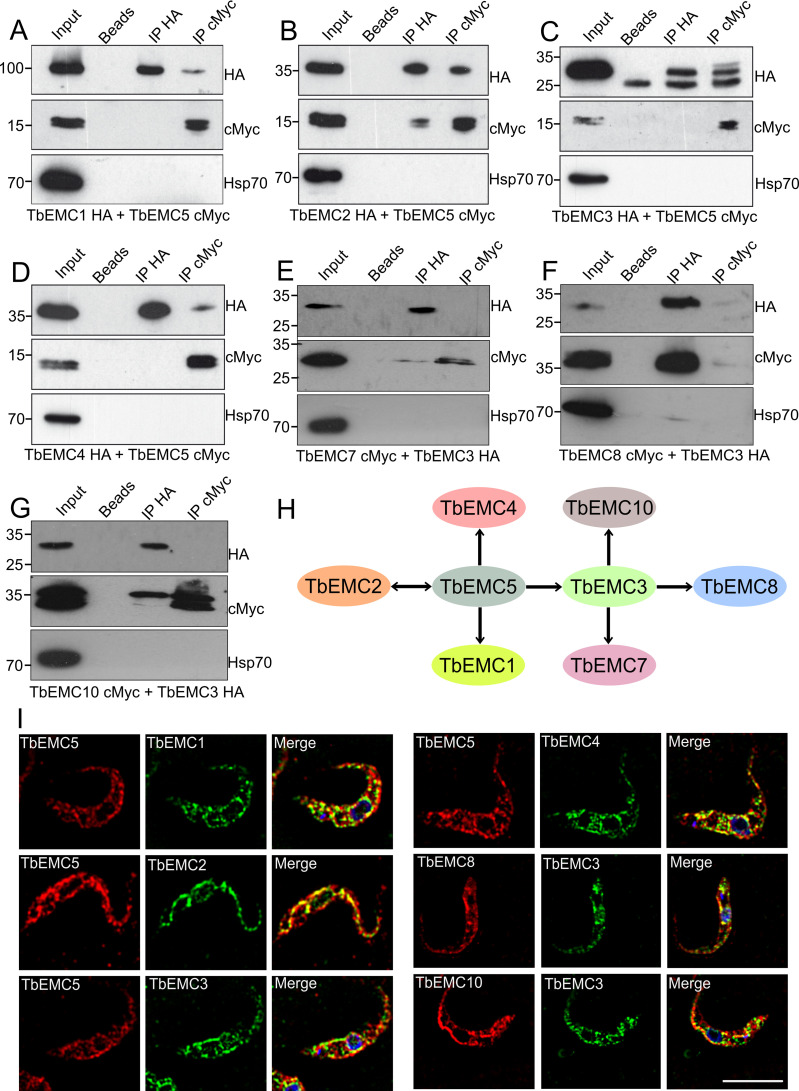
Fig 5. Interactions between individual TbEMCs.
A-G. Proteins from parasites co-expressing differently tagged TbEMC proteins (indicated below each panel) were immunoprecipitated using TbEMC5-cMyc (A-D) or TbEMC3-HA (E-G) as bait. Proteins from the input (1% of total), washed beads, and both immunoprecipitations (IP; with 3–10% of the sample being applied to detect the bait protein and 90–97% to detect the putative interaction partner) were analyzed by SDS-PAGE and immunoblotting using anti-HA or anti-cMyc antibodies as indicated, in combination with the corresponding second antibodies. Heat shock protein 70 (Hsp70) was used as negative control and visualized by specific antibodies. H. Schematic representation of co-immunoprecipitated TbEMC subunits using TbEMC5 and TbEMC3 as baits. Double headed arrows indicate reciprocal co-immunoprecipitation. I. Parasites co-expressing different pairs of in situ-tagged TbEMCs (indicated in the individual panels) were fixed and analyzed by immunofluorescence microscopy using the corresponding first and second antibodies to visualize the two TbEMC proteins (in red for cMyc; in green for HA; left two panels). DNA was stained with DAPI in the merge (in blue; right panels). Scale bar = 5 μm.

