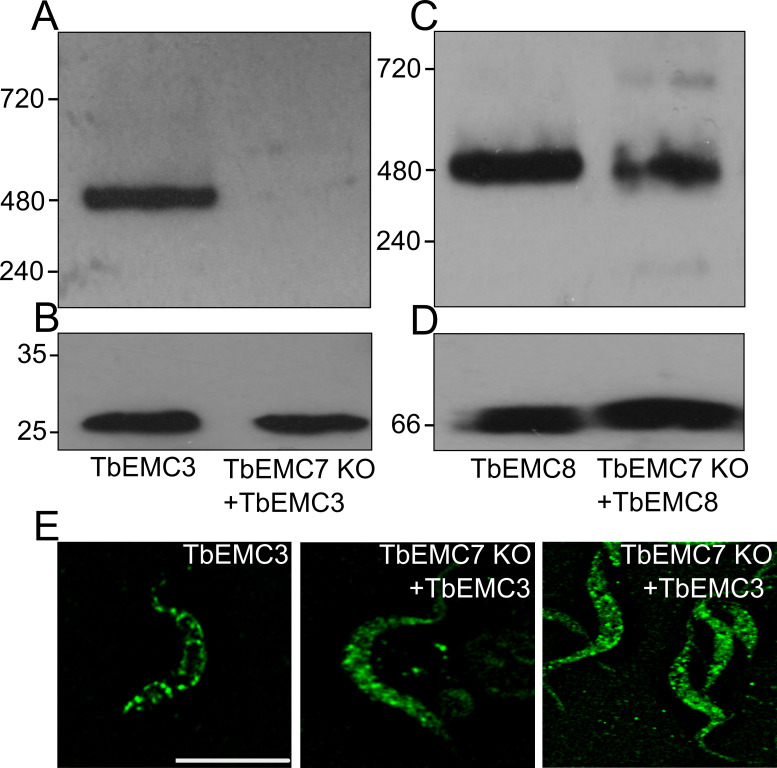
Fig 7. Analysis of TbEMC integrity.
A-D. Crude membrane fractions from control cells (A; EMC3; C: EMC8) and TbEMC7-KO parasites (A: EMC7 KO + EMC3; C: EMC7 KO + EMC8) expressing in situ-tagged TbEMC3-cMyc or TbEMC8-cMyc, respectively, were analyzed by native PAGE (A, C) and immunoblotting using anti-cMyc antibody and visualized by the corresponding second antibody. The samples were also analyzed by SDS-PAGE and immunoblotting using anti-cMyc antibody (B) or an antibody against T. brucei ADP/ATP carrier 1 (AAC1; as loading control) (D) and visualized by the corresponding second antibodies. Molecular mass markers (in kDa) are indicated in the left margins. E. Control cells (EMC3) and TbEMC7-KO parasites (EMC7 KO + EMC3) expressing in situ-tagged TbEMC3-cMyc were fixed and analyzed by immunofluorescence microscopy using anti-cMyc antibody and the corresponding second antibody. Scale bar = 5 μm.

