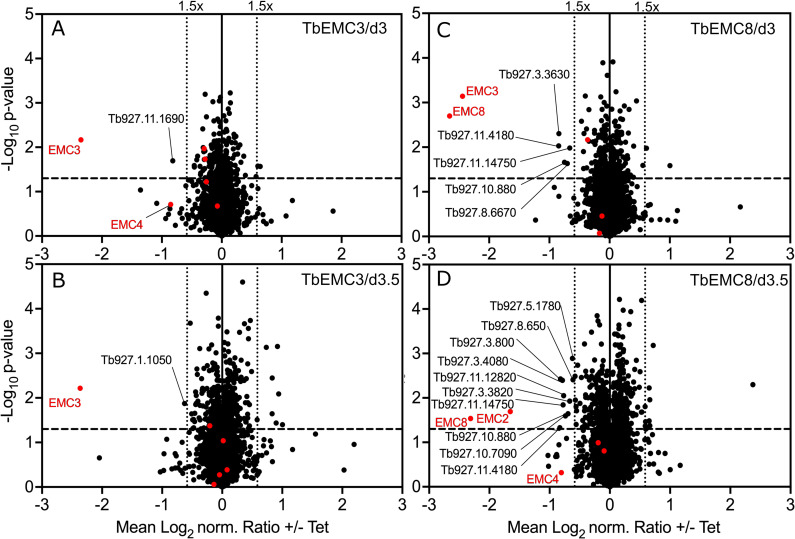
Fig 9. Volcano plots of a SILAC-based quantitative MS analysis of whole cell extracts of uninduced and induced RNAi cell lines.
EMC3-RNAi (A, B) and EMC8-RNAi (C, D) parasites grown in SILAC media were harvested after 3 (A, C) or 3.5 (B, D) days of induction. Proteins were quantified in three independent biological replicates, with the mean log2 of normalized (norm.) ratios plotted against the −log10 P value (two-sided t-test). The horizontal dashed line indicates a significance level of p = 0.05. The vertical dotted lines mark proteins with a 1.5-fold change in abundance compared to control uninduced cells. Known TbEMC subunits are represented as red dots. Non-TbEMC proteins downregulated more than 1.5-fold are labeled with accession numbers.

