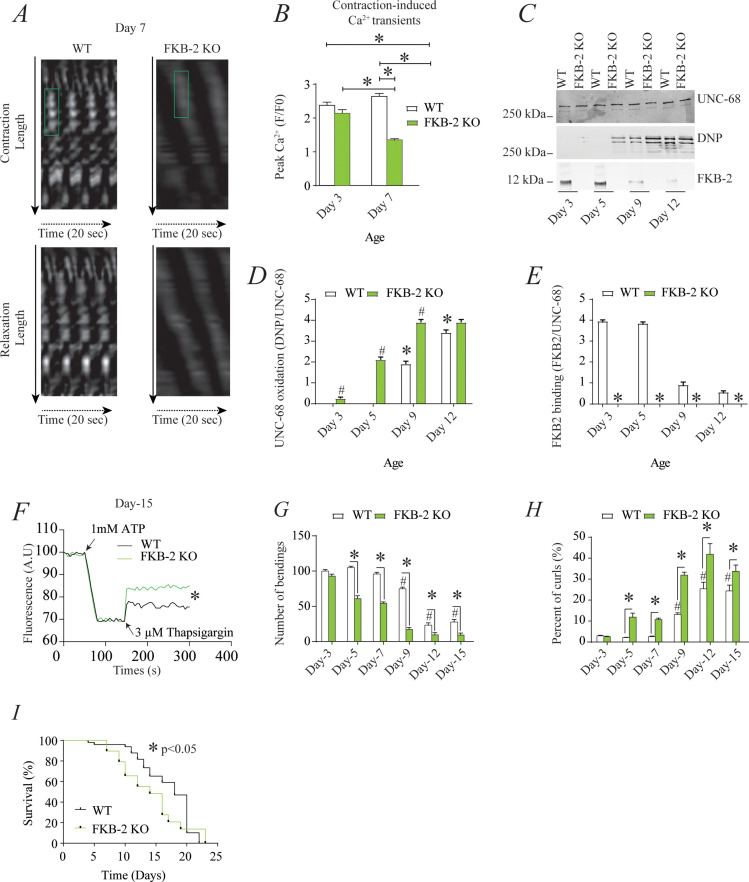
Figure 2. Remodeling of UNC-68 and age-dependent reduction in intracellular calcium (Ca2+) transients is accelerated in FKB-2 (ok3007) (A) Representative trace of Ca2+ transients from GCaMP2 wild type (WT) and FKB-2 KO (at day 7).
Green box denotes peak fluorescence from worm’s muscle during contraction. (B) Ca2+ transients in age-synchronized populations of WT and FKB-2 (ok3007) nematodes (at day 3 and 7); (C) UNC-68 was immunoprecipitated from age-synchronized populations of mutant (FKB-2 KO) and WT nematodes (at day 3, 5, 9, and 12) and immunoblotted using anti-RyR, anti-calstabin, and dinitrophenyl (DNP; marker of oxidation) antibodies. (D and E) Quantification of the average band intensity from triplicate experiments: band intensity was defined as the ratio of each complex member’s expression over its corresponding /UNC-68’s expression. Data are means ± SEM. * p<0.05 WT vs. FKB-2 KO in panel D, # p<0.05 WT vs. FKB-2 KO in panel E, * p<0.05 WT at day 3 vs. WT at day 5 and day 9. (F) Ca2+ leak assay performed with microsomes from WT and FKB-2 KO worms (day 5). Ca2+ uptake into the microsomes was initiated by adding 1 mM of ATP. Then, 3 µM of thapsigargin was added to block the sarco/endoplasmic calcium ATPase activity. Increased fluorescence is proportional to the spontaneous Ca2+ leakage throughout UNC-68. (G) Graph showing number of bends recorded for WT vs. FKB-2 KO worms at six distinct ages (day 3, 5, 7, 9, 12, and 15). (H) The number of curling events was calculated as a percentage of the overall motility (curls/bends). N = ~60 worms per group, except for day 15 (as fewer worms were alive at this timepoint). Day 15 = ~40 worms. (I) Percentage of survival of WT (average survival; 18 days) and FKB-2 KO worms (average survival; 14 days); Gehan-Breslow-Wilcoxon test for survival comparison was performed for statistical significance. Data are means ± SEM from triplicate experiments. One-way ANOVA shows * p<0.05 WT vs. FKB-2 KO, # p<0.05 WT at day 3 vs. WT at day 5, 7, 9, 12, and 15. Figure 2—source data 1.

