. 2022 May 17;11:e78428. doi: 10.7554/eLife.78428

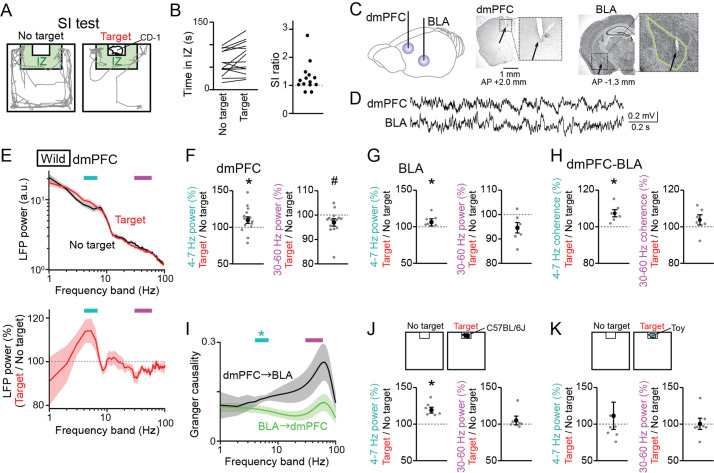
Figure 1. Changes in dorsal medial prefrontal cortex (dmPFC) and basolateral amygdala (BLA) Local field potential (LFP) signals in a social interaction (SI) test.

(A) A SI test with an interaction zone (IZ; labeled in green). Movement trajectories (gray lines) of a wild-type mouse are superimposed. (B) (Left) Occupancy time in the IZ. Each line indicates an individual mouse (n = 14 wild-type mice). (Right) SI ratios computed from the occupancy time. Each dot represents an individual mouse. (C) (Left) LFPs were recorded from the dmPFC and BLA. (Right) Histological confirmation of electrode locations (arrows). The dotted boxes are magnified in the right panels. The green line shows the contour of the BLA. The details of electrode locations are shown in Figure 1—figure supplement 1. (D) Typical LFP signals from the dmPFC and BLA. (E) (Top) Comparison of dmPFC LFP power spectrograms between the target (red) and no target (black) sessions averaged over all mice (n = 14 mice). Original datasets from individual mice are shown in Figure 1—figure supplement 2A. Data are presented as the mean ± SEM. Cyan and magenta bars above represent 4–7 Hz and 30–60 Hz bands, respectively. (Bottom) The percentages of LFP power at individual frequency bands in the target session relative to those in the no target session. The percentages were computed in individual mice and were averaged over all mice. (F) The percentages of dmPFC 4–7 Hz (left) and 30–60 Hz (right) LFP power averaged over an entire period of the target session relative to those of the no target session (n = 14 mice). Data are presented as the mean ± SEM. Each gray dot represents an individual data points. * and # represent a significant increase and decrease in the target session, respectively (p<0.05, paired t-test vs no target). (G) Same as F but for the BLA (n = 6 mice). (H) Same as F but for dmPFC-BLA coherence (n = 6 mice). (I) Spectral granger causality averaged over dmPFC-BLA electrode pairs. (n = 6 mice). *p<0.05, Mann-Whitney U test followed by Bonferroni correction. (J, K) Same as F but when an unfamiliar C57BL/6J mouse was used as a target mouse (J) or a toy mouse was placed in the cage instead of a target mouse (K).

Figure 1—source data 1. Individual data for Figure 1.

Figure 1.

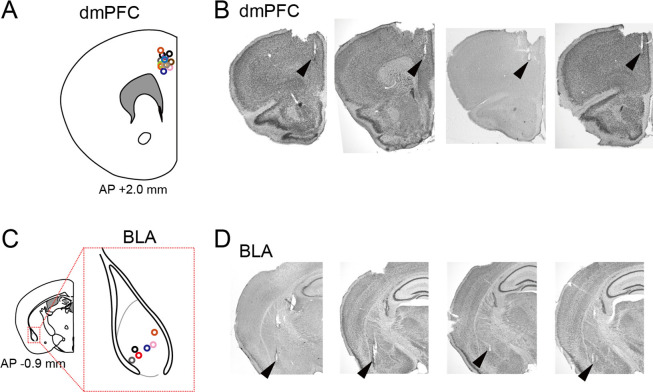
Figure 1—figure supplement 1. Confirmation of recording sites.

Figure 1—figure supplement 1.

(A) Superimpositions of recording sites for all electrodes in wild-type mice (from 14 mice shown in Figure 1) indicated by circles on the dorsal medial prefrontal cortex (dmPFC). (B) Typical pictures of cresyl violet-stained sections with the arrowheads indicating the tips of electrode tracks. (C) Same as A but for the basolateral amygdala (BLA) (from 6 mice shown in Figure 1). The gray dotted line represents the border to define the BLA region. (D) Same as B but for the BLA.
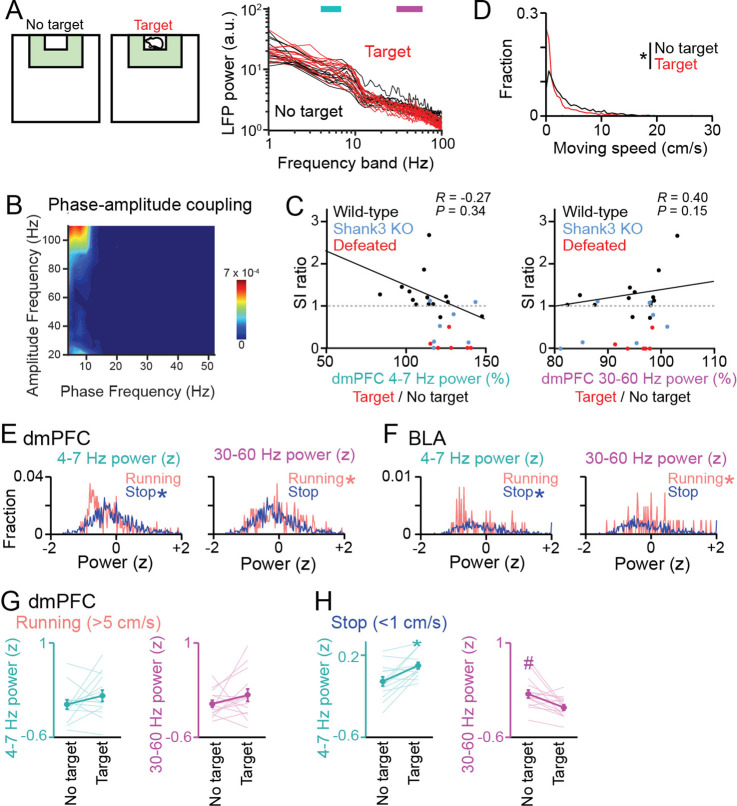
Figure 1—figure supplement 2. Datasets for local field potential (LFP) power analyses in Figure 1E–G.

Figure 1—figure supplement 2.

(A) Supplementary datasets for Figure 1E. Original dorsal medial prefrontal cortex (dmPFC) LFP power spectrograms between the target (red) and no target (black) sessions for individual mice shown in Figure 1E (n = 14 wild-type mice). Each line shows each mouse. (B) Phase-amplitude coupling measures for a dmPFC LFP trace in the target session in a typical mouse, shown by contour plots of modulation index for all pairs of high (y-axis, gamma-range) and low (x-axis, theta-range) frequencies. Warm colors indicate stronger modulation. No pronounced coupling was observed. (C) Relationship between the percentages of dmPFC LFP power changes in the target session (corresponding with Figures 1F and 3B) and SI ratios (corresponding with Figure 1B). Each dot represents each mouse (n = 14 wild-type (black), 7 Shank3 knockout (KO) (blue), and 6 defeated (red) mice). In wild-type mice, no significant correlations were found between these variables (Black line). (D) Comparison of moving speed distributions between the no target and target sessions (n = 2086 frames; Z = 20.20, p=9.0 × 10-89, Mann-Whitney U test). (E, F) Comparisons of distributions of LFP power between running (>5 cm/s) and stop (<1 cm/s) periods in the target session (dmPFC, n = 254, and 1,008 frames; 4–7 Hz: Z = 4.93, p=8.26 × 10⁻⁷; 30–60 Hz: Z = 2.13, p=0.033; BLA, n = 58, and 519 frames; 4–7 Hz: Z = 2.42, p=0.016; 30–60 Hz: Z = 2.00, p=0.045, Mann-Whitney U test). Asterisks represent significantly higher power. (G) Supplementary datasets for Figure 1F. Comparison of z-scored dmPFC 4–7 Hz (cyan) and 30–60 Hz (magenta) power specifically computed from running periods between the target and no target sessions (n = 14 mice). LFP power at each frequency band was z-scored based on the average and SD of LFP power at each frequency band in an entire period including the no target and target sessions. Data are presented as the mean ± SEM. Each thin line represents each mouse. p>0.05, paired t-test. (H) Same as G but specifically computed from stop periods. * and # represent a significant increase and decrease in the target session, respectively (p<0.05, paired t-test vs no target).
Figure 1—figure supplement 3. Analyses for the frequency bands other than 4–7 Hz and 30–60 Hz.
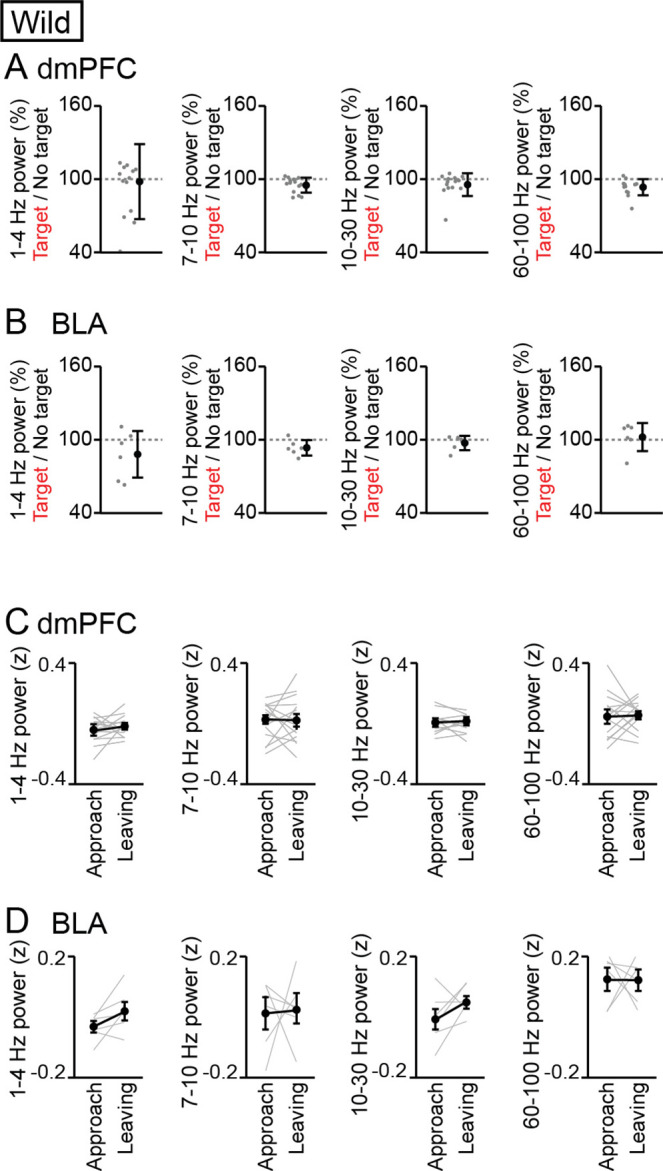
Figure 1—figure supplement 3.

(A, B) Supplementary datasets for Figure 1F and G. For the frequency bands of 1–4 Hz, 7–10 Hz, 10–30 Hz, and 60–100 Hz, the percentages of dorsal medial prefrontal cortex (dmPFC) (A) and basolateral amygdala (BLA) (B) Local field potential (LFP) power averaged over an entire period of a session in the target session relative to those in the no target session (n = 14 mice). Data are presented as the mean ± SEM. Each gray dot represents an individual data points. No significant differences were found in these comparisons (p>0.05, paired t-test followed by Bonferroni correction, target vs no target). (C, D) Supplementary datasets for Figure 5F. For the frequency bands of 1–4 Hz, 7–10 Hz, 10–30 Hz, and 60–100 Hz, LFP power in the dmPFC (C) and BLA (D) was compared power between approach and leaving behavior (n = 14 and 6 mice respectively). Data are presented as the mean ± SEM. No significant differences were found in these comparisons (p>0.05, paired t-test followed by Bonferroni correction, approach vs leaving).