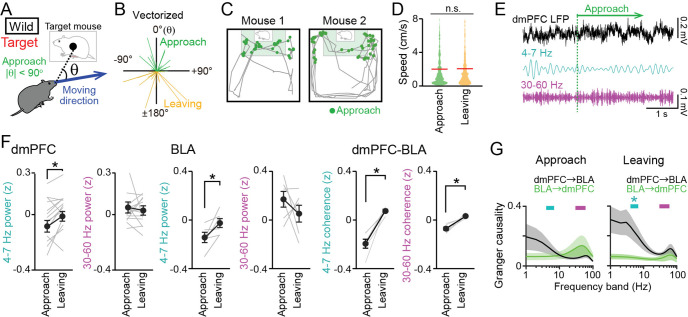
Figure 5. Decreases in dorsal medial prefrontal cortex (dmPFC) 4–7 Hz local field potential (LFP) power during social approach behavior in the target session.
(A) Social approach and leaving behavior in wild-type mice was defined when absolute cage-oriented moving directions (|θ|) were less than and more than 90°, respectively, in the half of the box containing the interaction zone (IZ). (B) A polar plot of vectorized instantaneous animal trajectories (bin = 1 s) as a function of cage-oriented moving direction. (C) Trajectories from two representative mice (gray). Green dots represent social approach behavior. (D) Distributions of moving speed during approach and leaving behavior (n = 644 and 577). The red lines show the average. p>0.05, Mann-Whitney U test. (E) Unfiltered and bandpass (4–7 Hz and 30–60 Hz)-filtered dmPFC LFP traces in the target session. The green line indicates the onset of a social approach behavior. (F) Comparison of 4–7 Hz and 30–60 Hz power in the dmPFC (left, n = 14 mice) and basolateral amygdala (BLA) (middle, n = 6 mice) and dmPFC-BLA 4–7 Hz and 30–60 Hz coherence (right, n = 6 mice) between approach and leaving behavior. Data are presented as the mean ± SEM. Each gray line represents each mouse. *p<0.05, paired t-test. (G) Spectral Granger causality during approach (top) and leaving (bottom) behavior in the target session averaged over dmPFC-BLA electrode pairs. *p<0.05, Mann-Whitney U test followed by Bonferroni correction.


