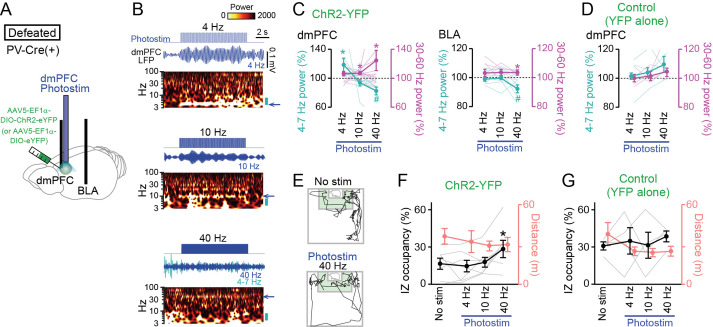
Figure 7. Restoration of social approach behavior by optogenetic photostimulation with a decrease in 4–7 Hz power and an increase in 30–60 Hz power in the dorsal medial prefrontal cortex (dmPFC).
(A) Schematic illustration. PV-positive interneurons expressing ChR2-YFP (or YFP alone) in the dmPFC were optogenetically stimulated, while local field potential (LFP) signals were recorded from the dmPFC and basolateral amygdala (BLA) in PV-Cre mice subjected to social defeat stress. (B) (From top to bottom) Photostimulation at 4, 10, and 40 Hz for 10 s in defeated mice injected with AAV5-EF1a-DIO-ChR2-eYFP. Each panel shows photostimulation patterns (upper), representative dmPFC LFP traces filtered at the frequency band similar to that of photostimulation (middle) and its wavelet spectrum (lower). At 40-Hz photostimulation, the LFP trace filtered at 4–7 Hz is superimposed as the cyan trace. The blue arrows beside the wavelet spectrum show the corresponding band and the cyan bars represents the 4–7 Hz band. (C) Average 4–7 Hz (cyan) and 30–60 Hz (magenta) power changes by dmPFC photostimulation in the dmPFC (left) and BLA (right) in defeated mice injected with AAV5-EF1a-DIO-ChR2-eYFP. (n = 7 mice). Each thin line represents each mouse. * and # represent a significant increase and decrease, respectively (p<0.05, paired t-test versus baseline). (D) Same as C but for control mice injected with AAV5-EF1a-DIO-eYFP (n = 4 mice). (E) Movement trajectories of a defeated mouse in a target session with no stimulation and 40-Hz photostimulation. (F) The percentage of time spent in the IZ (left axis, black) and total travel distance (right axis, thin red) in defeated mice injected with AAV5-EF1a-DIO-ChR2-eYFP (n = 7 mice). Data are presented as the mean ± SEM. Each gray line represents each mouse. *p<0.05, paired t-test followed by Bonferroni correction. (G) Same as F but for defeated mice injected with AAV5-EF1a-DIO-eYFP (n = 5 mice).

