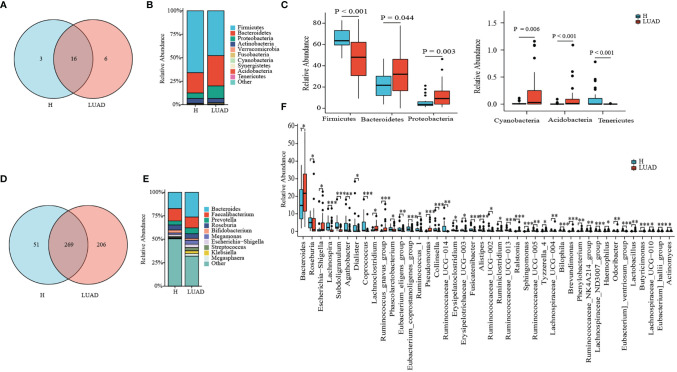
Figure 2.
Taxonomy comparison of gut microbiome. (A) 19 and 22 phyla were identified in H group and LUAD group, respectively. (B) The distribution of top 10 phyla in two groups. (C) Differential phyla between two groups. (D) 320 and 475 genera were identified in H group and LUAD group, respectively. (E) The distribution of the top 10 genera in two groups. (F) Differential genera between two groups. *P < 0.05, **P < 0.01, ***P < 0.001.

