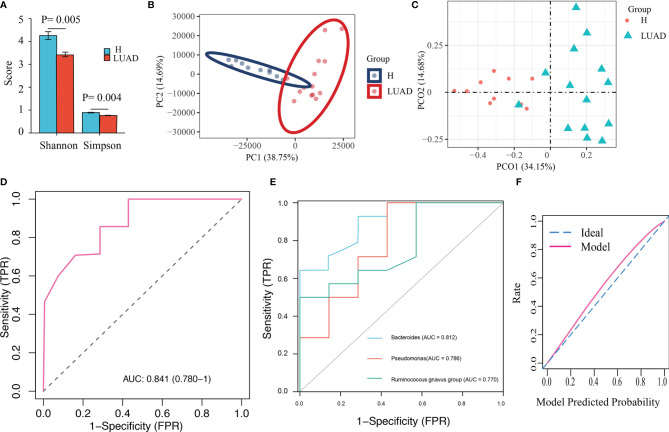
Figure 5.
Validation of the diagnostic model with Metagenomics. (A) The α diversity is evaluated by Shannon and Simpson index. (B) The β diversity was evaluated by PCA analysis. (C) The β diversity was evaluated by PCoA analysis. (D) The ROC of the diagnostic model. (E) The ROC of three biomarker’s taxa. (F) The calibration plot of the diagnostic model.

