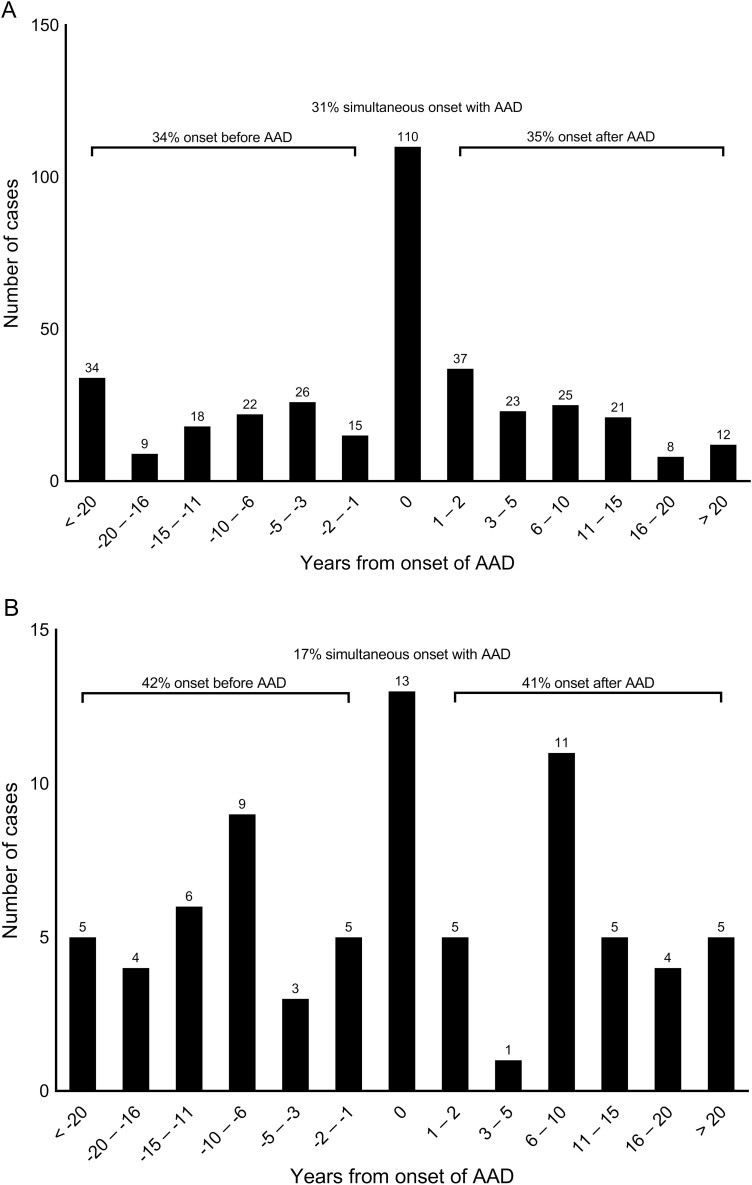
Figure 2.
Onset of thyroid disorder. A, Bar chart illustrating the temporal relationship between onset of autoimmune Addison disease (AAD) and hypothyroidism in 361 of 380 patients. Year of diagnosis on the X axis. 0 is defined as simultaneous onset (diagnosis within same year) of AAD and hypothyroidism. For 19 patients, year of diagnosis was missing. B, Bar chart illustrating the temporal relationship between onset of AAD and hyperthyroidism in 76 of 78 patients. Year of diagnosis on the X axis. 0 is defined as simultaneous onset (diagnosis within same year) of AAD and hyperthyroidism. For 2 patients, year of diagnosis was missing.

