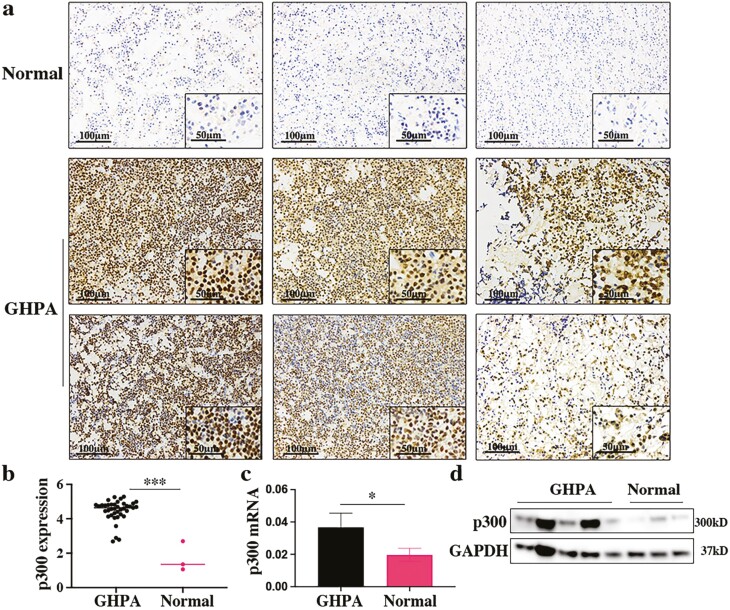
Figure 1.
p300 expression profile in GHPA and normal pituitary tissue. (a) IHC image of p300 expression in normal pituitary and GHPA tissues. Each column represents a different sample. Scale bars: 100 μm left, 50 μm right. (b) Logarithmized IOD value of p300 expression according to IHC images of GHPA tissues (n = 39) and normal pituitary tissues (n = 3). (c) The mRNA expression of p300 in specimens (GHPA: n = 5; Normal: n = 3) assessed by qRT-PCR. (d) The protein expression of p300 in specimens (GHPA: n = 5; Normal: n = 3) assessed by Western blotting. *P < 0.05, **P < 0.01, ***P < 0.001. The bar represents ± SD.

