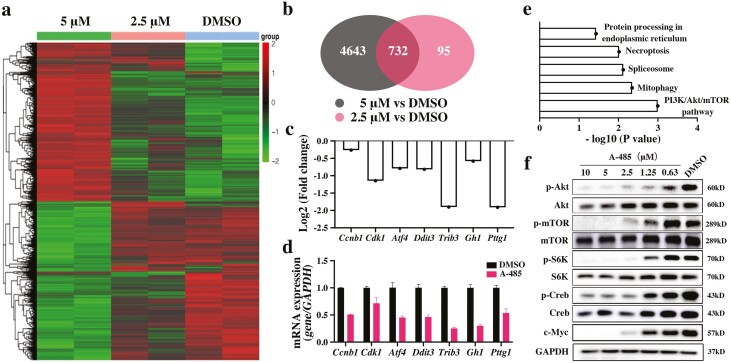
Figure 5.
Exploration of the potential mechanism affected by A-485. (a) Heat maps of differentially expressed genes at different concentrations of A-485. (b) Venn diagrams showing the overlapping genes between each group. (c) The fold changes in hub genes based on the RNA sequencing. (d) The mRNA expression of hub genes was verified by qRT-PCR. (e) KEGG analysis indicated the specific signaling pathways affected by A-485. (f) The protein expressions of key molecules affected by A-485 were detected by Western blotting. The bar represents ± SD.

