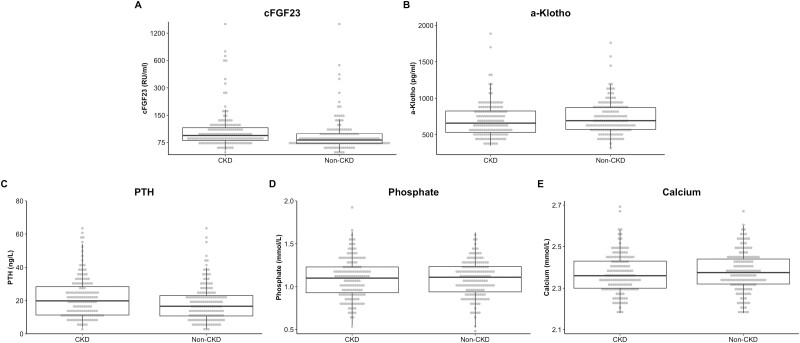
Figure 2.
Levels of bone and mineral parameters in CKD and non-CKD. Dots represents each individual value stratified by CKD status. Boxes indicate the interquartile range of a parameter, and the bold horizontal line indicates the median. Vertical lines below and above each box indicate the 5th and 95th percentile of each parameter. Bbreviations: CKD, chronic kidney disease; PTH, parathyroid hormone.

