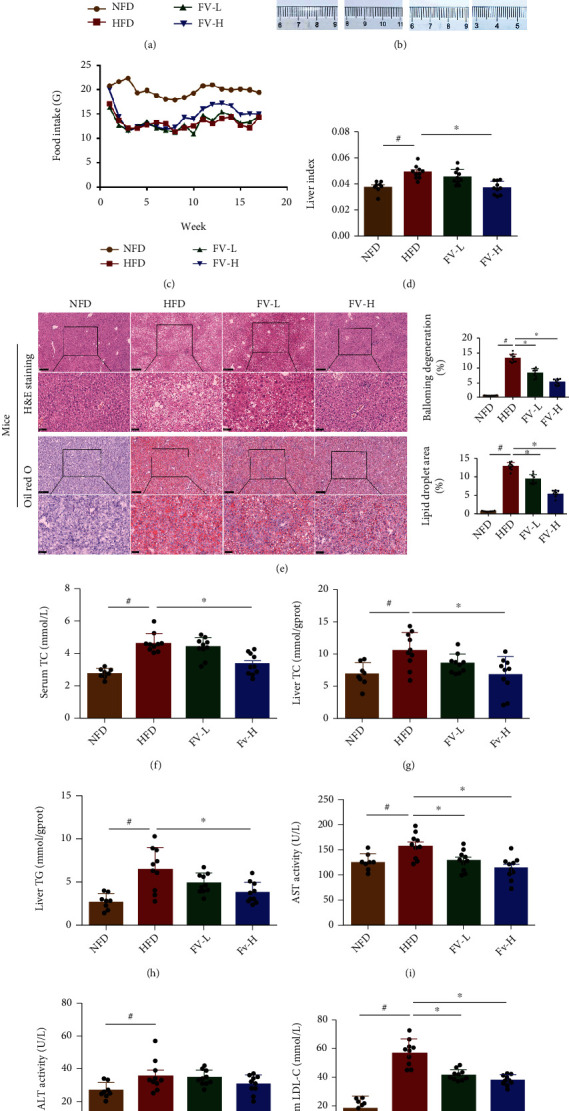
Figure 3.

Effects of FV on accumulation of liver fat and lipid levels in serum in HFD-fed mice. (a) Body weight, (b) macroscopic observation of livers in subjects in different groups, (c) weekly food intake per mouse in each group, (d) liver index, (e) light microscopic H&E image and oil red O staining image of liver tissues of subjects in different groups (x100 original magnification, scale bar = 250 μm; 400x original magnification, scale bar = 50 μm), H&E score and oil red O score, (f) serum TC, (g) liver TC, (h) liver TG, (i) serum AST, (j) ALT, and (k) serum LDL-C. The data are expressed in the format of mean ± SD (n = 8, 10, 10). #P < 0.05 means there is a significant difference between the NFD group and the HFD group. ∗P < 0.05 means the difference between the HFD group and the FV-L group or the FV-H group is significant. NFD: normal fat diet group; HFD: high-fat diet group; FV-L group: high-fat diet with FV administration at dose of 5 g medicinal materials/kg body weight; FV-H group: high-fat diet with FV at dose of 10 g medicinal materials/kg body weight.
