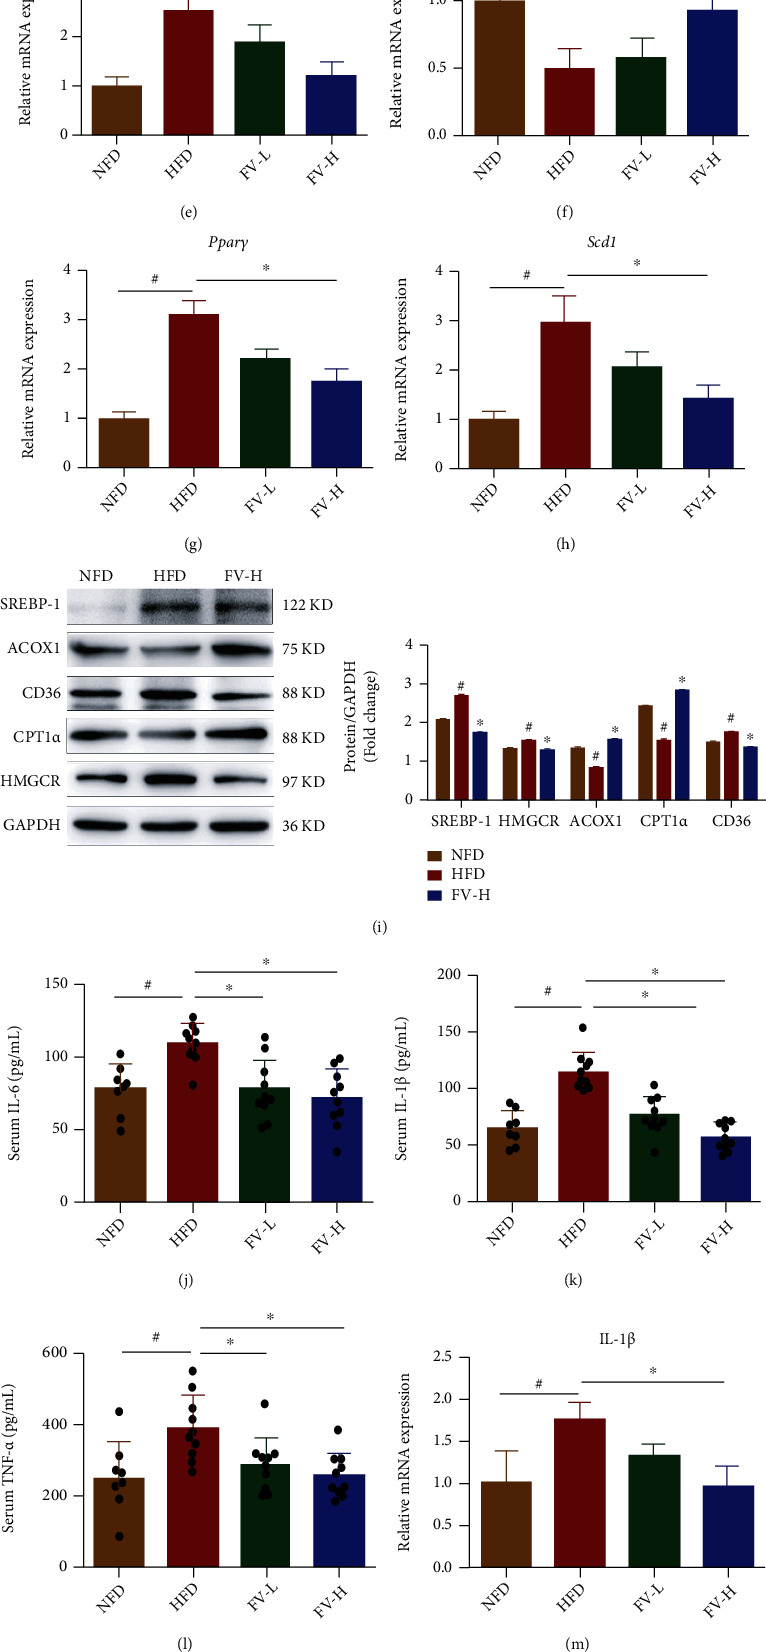
Figure 4.

Effects of FV on liver lipogenesis-related markers in the mice fed with HFD. (a–h) The relative mRNA expression levels of Acaca, Cd36, Cpt1α, Srebp-1, Hmgcr, Pparα, Pparγ, and Scd1 were determined by qRT-PCR. (i) The lipid metabolism relevant protein levels of SREBP-1, ACOX1, CD36, CPT1α, and HMGCR were analyzed by western blotting, and the relative ratios were calculated. (j–l) Serum IL-6, IL-1β, and TNF-α were identified by ELISA kits. (m, n) The relative mRNA expression levels of IL-1β, TNF-α, and Ccl5 were identified by qRT-PCR. (p) The proinflammatory factor protein levels of IL-1β, IL-6, and TNF-α were analyzed by western blotting, and their relative ratios were calculated. The densitometry was obtained by averaging repeated experiments results, normalized to GAPDH. The data are expressed as the mean ± SD, n = 3. #P < 0.05 means there is significant difference between the NFD group and the HFD group. ∗P < 0.05 means the difference between the HFD group and the FV-L group or the FV-H group is significant.
