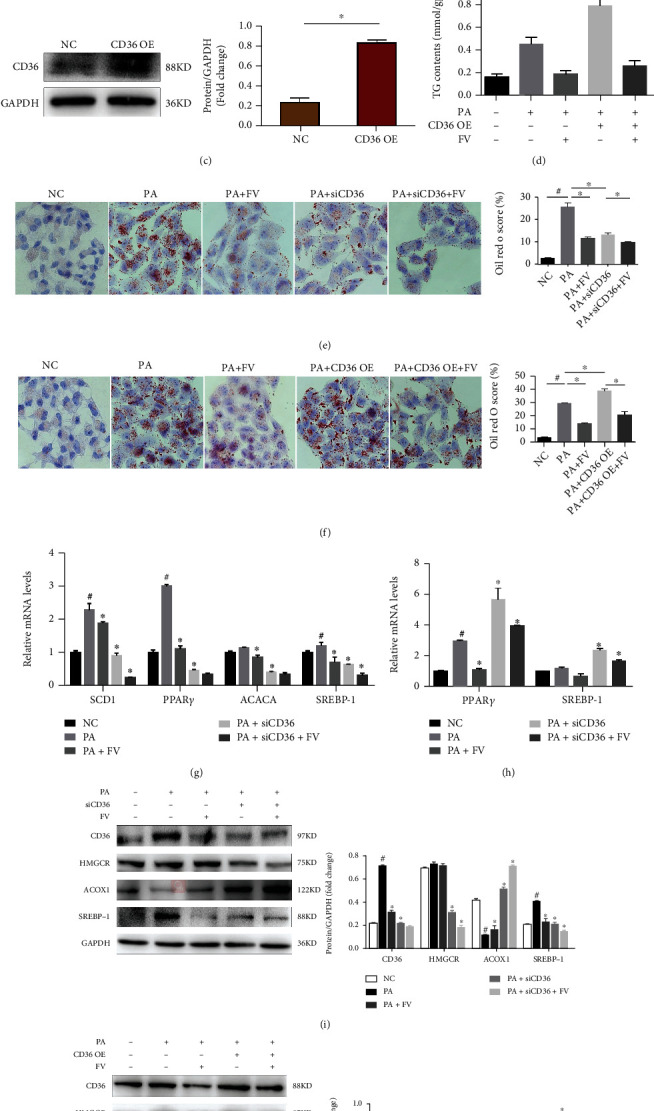
Figure 6.

Alleviation of lipid accumulation and inflammation by FV through regulating CD36 in HepG2 cells with PA inducement. (a, c) CD36 protein levels after CD36 knockdown or CD36 overexpression and quantitative analysis. (b, d) TG contents of HepG2 cells in different treatment groups. (e, f) Oil red O to examine the accumulation level of lipid in HepG2 cells and their quantified scores (magnification 100x, scale bar = 250 μm). (g) The mRNA levels of SCD1, PPAR γ, ACACA, SREBP-1, IL-1β, and CCL5 in siCD36 HepG2 cells with or without FV administration under the condition of PA inducement. (h) The mRNA levels of PPAR γ, SREBP-1, IL-1β, and TNF-α in CD36 OE HepG2 cells with or without FV administration under the condition of PA inducement. (i) The protein levels of CD36, HMGCR, ACOX1, and SREBP-1 in siCD36 HepG2 cells. (j) The protein levels of CD36, HMGCR, ACOX1, and SREBP-1 in CD36 OE HepG2 cells. n = 3, ∗P < 0.05 vs. NC group for (a, c); #P < 0.05 vs. NC group, ∗P < 0.05 vs. PA group or PA+siCD36 group/PA+CD36 OE group (b–j).
