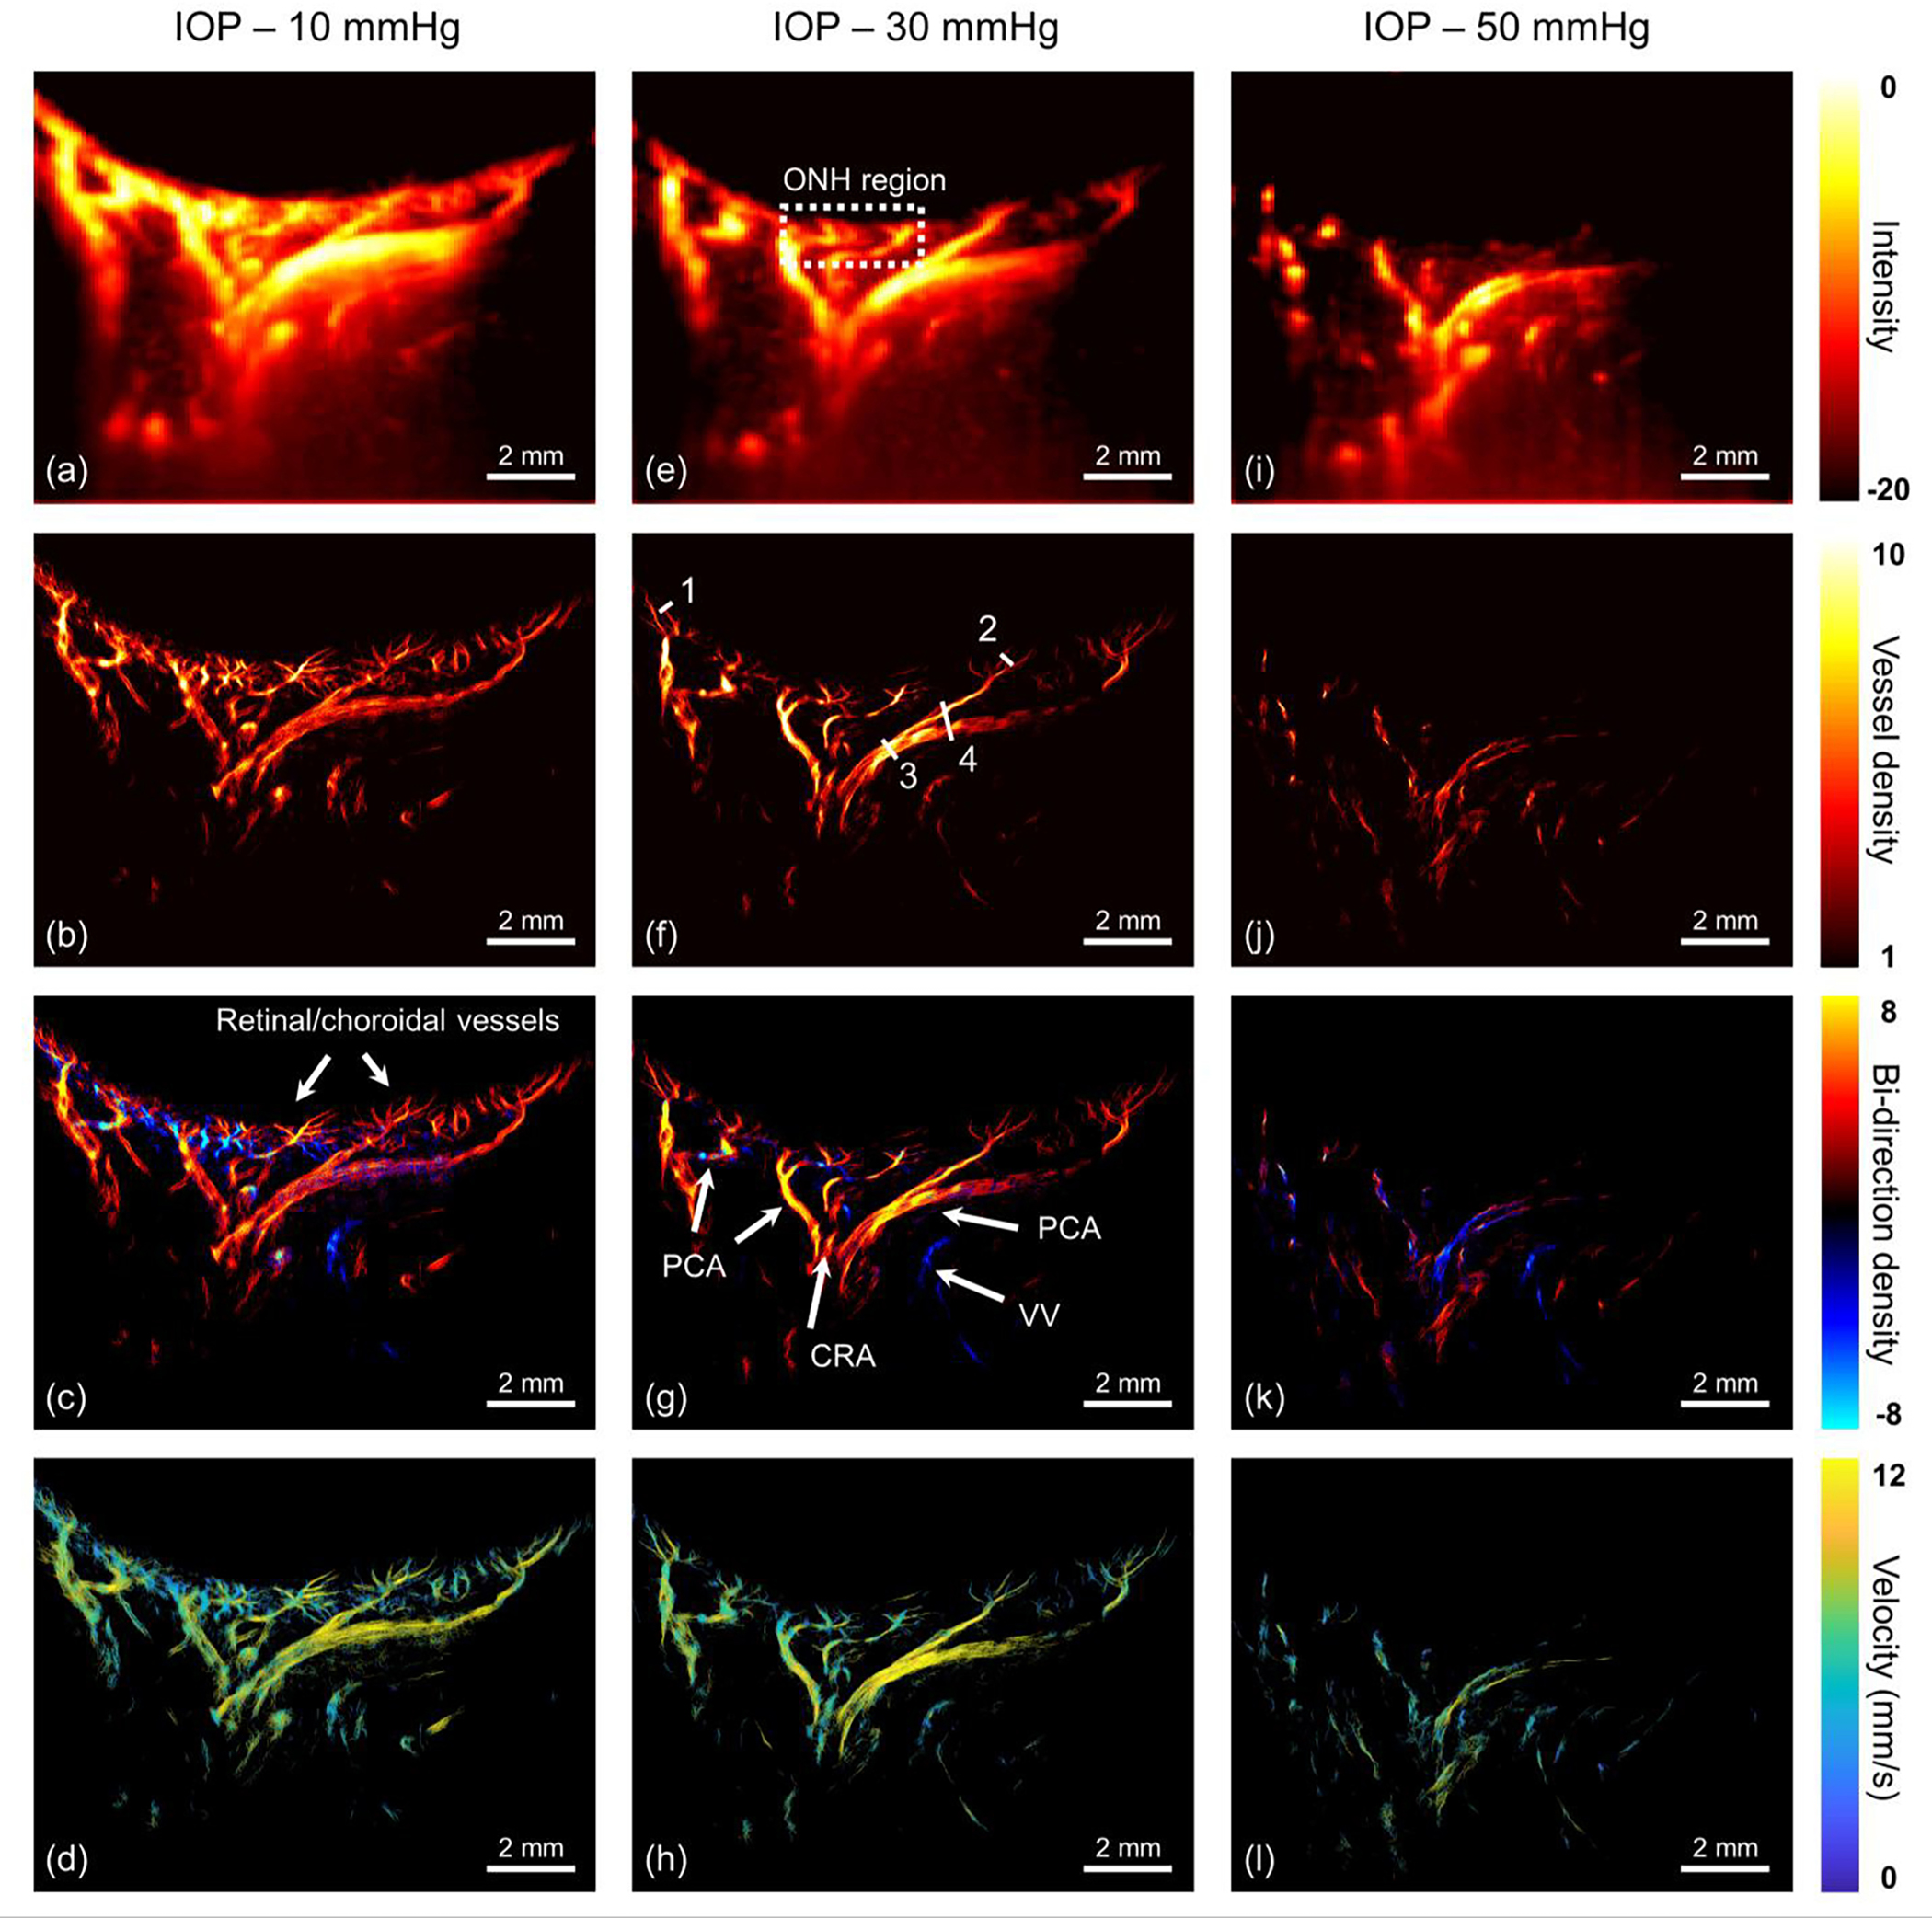
Fig. 7.

In vivo visualization of the eye vasculature network under different IOPs. (a-d) 10 mmHg, (e-h) 30 mmHg and (i-l) 50 mmHg. From the 1st row to 4th row, the corresponding images are ultrasensitive power Doppler image, super-resolution microvessel image, super-resolution bi-directional microvessel image and super-resolution flow velocity image, respectively. The dash box refers to the optic nerve head region. All solid arrows represent reconstructed vessels ranging from capillary-level vessel to major supporting vessels, including retinal/choroidal vessels, central retinal artery (CRA), posterior ciliary artery (PCA) and vortex veins (VV). Four line markers in (f) were used to calculate the detectable resolution and the resolved distance. Note: dynamic range of (i) is [−12 0] for the better visualization purpose.
