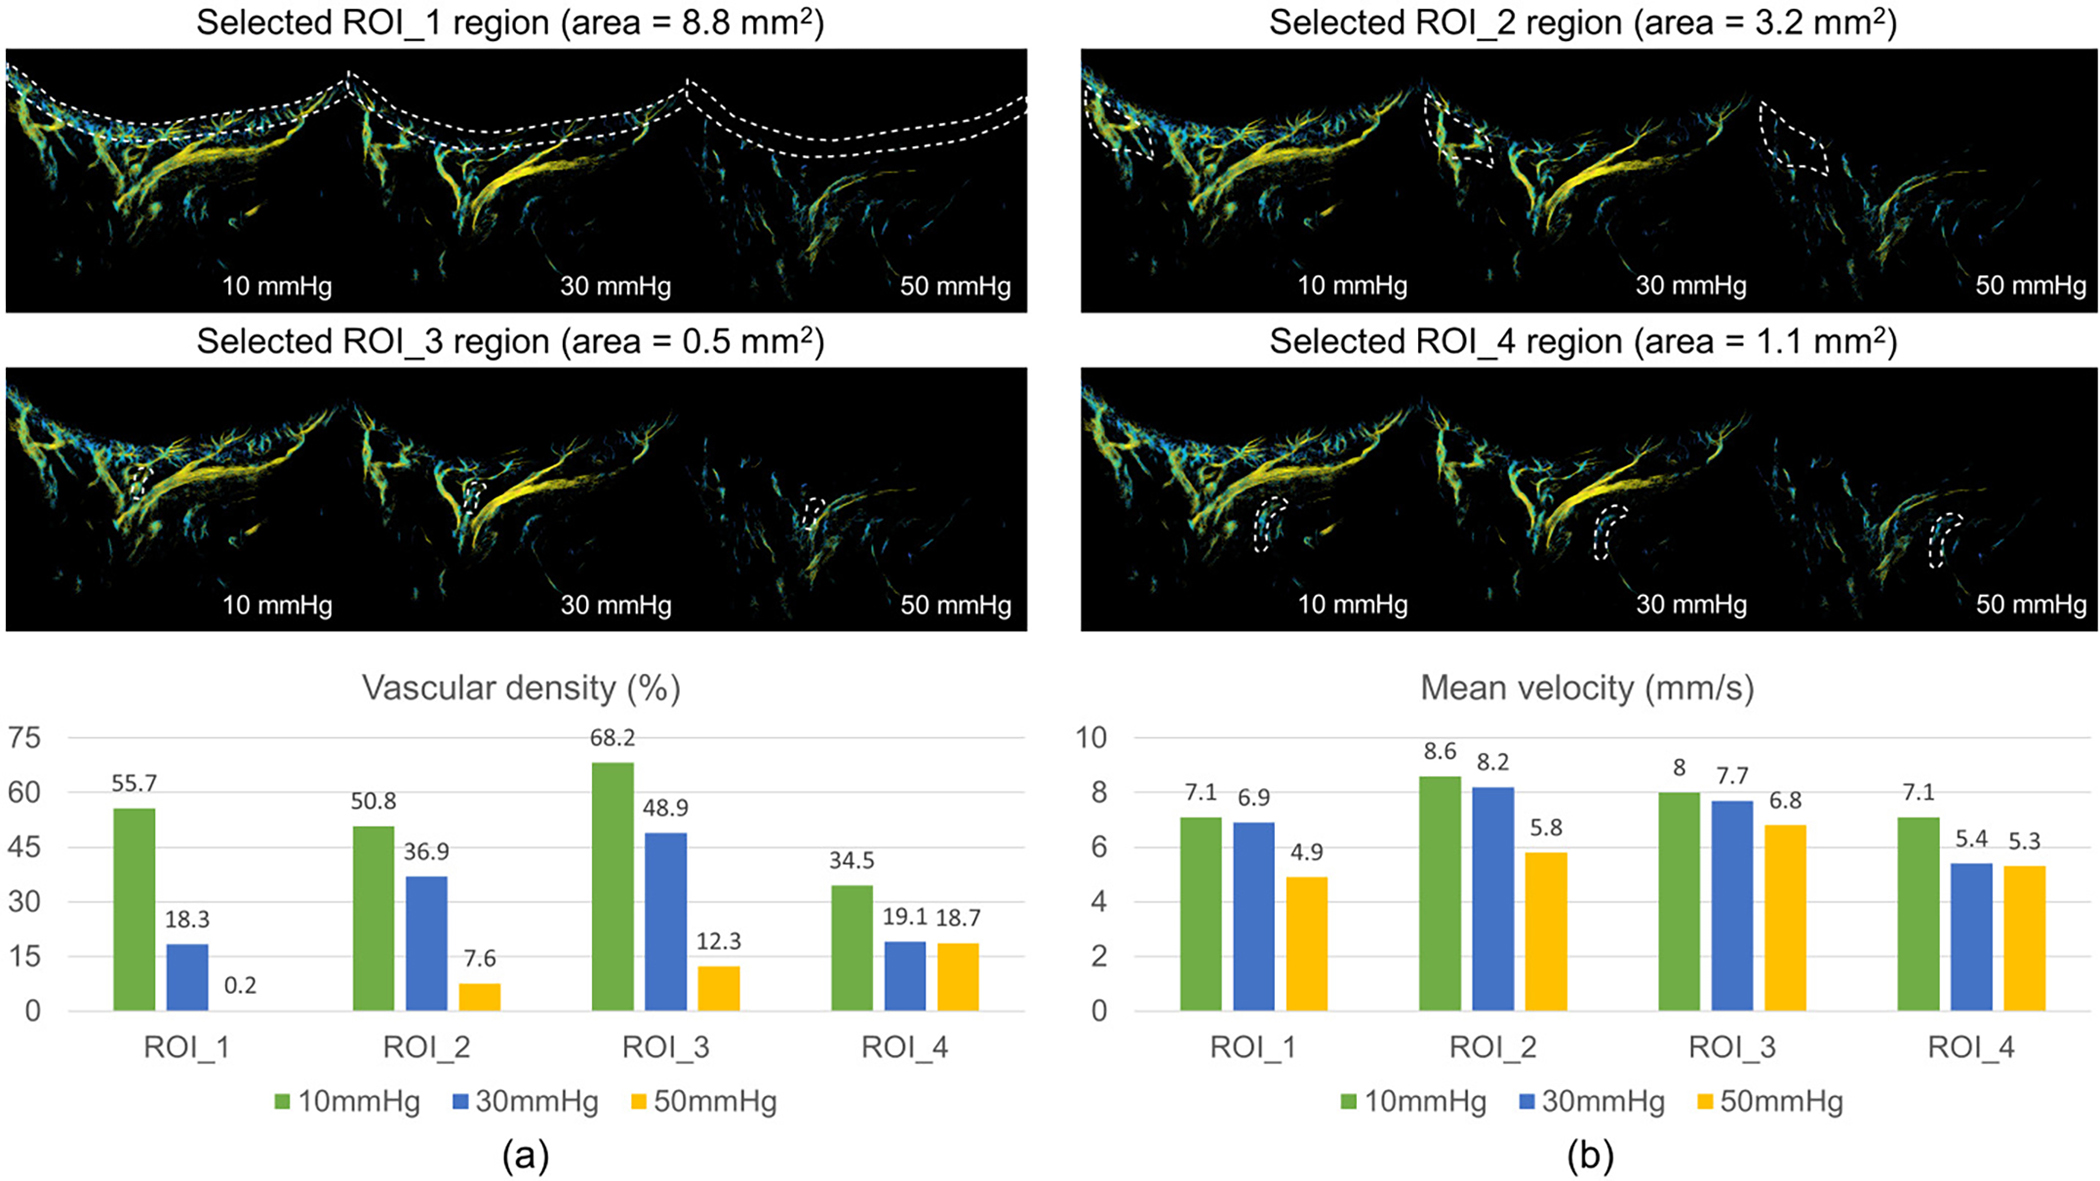
Fig. 8.

The measured vascular density (a) and mean flow velocity (b) on selected ROIs. A total of four ROIs were investigated in this study. ROI_1 is where retinal/choroidal vessels are dominant; ROI_2, ROI_3 and ROI_4 are large supporting vessels, corresponding to PCA, CRA and VV, respectively. The white dash lines describe the selected regions used to calculate the mean flow velocity and vascular density.
