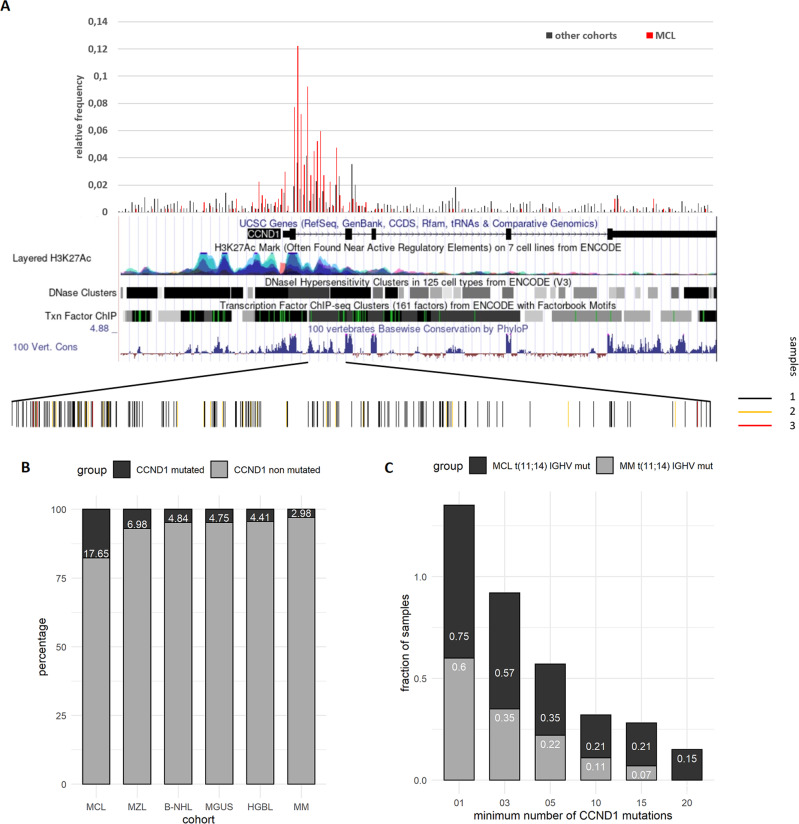
Fig. 2. Frequency of non-coding variants in the CCND1 locus.
A Non-coding variants in the genomic region chr11:69450872-69469242 (hg19) covering the CCND1 locus including 5 kb upstream of the TSS were collected for all MCL and non-MCL samples. Red bars indicate the relative frequency of non-coding variants in the MCL cohort. Black bars refer to the relative frequency of non-coding variants in non-MCL samples. A screenshot from the UCSC genome browser of the CCND1 locus shows the density of H3K27 acetylation marks, the density of DNase 1 hypersensitivity sites, and transcription factor-binding regions, as well as the level of sequence conservation. The bars at the bottom of the panel indicate the distribution of individual variants in the first intron. The color of the bars indicates the number of samples a particular variant was observed in. B Plot of the percentage of samples with five or more non-coding variants in the CCND1 transcription regulatory region (chr11: 69450872-69458025, hg19) for indicated cohorts. Abbreviations for cohort names are described in Table 1. C Plot of the fraction of samples by the minimum number of non-coding variants in the CCND1 transcription regulatory region for Multiple Myeloma (MM) and MCL samples. Only samples carrying a t(11;14)(q13;q32) translocation and mutated IGHV status were included.

