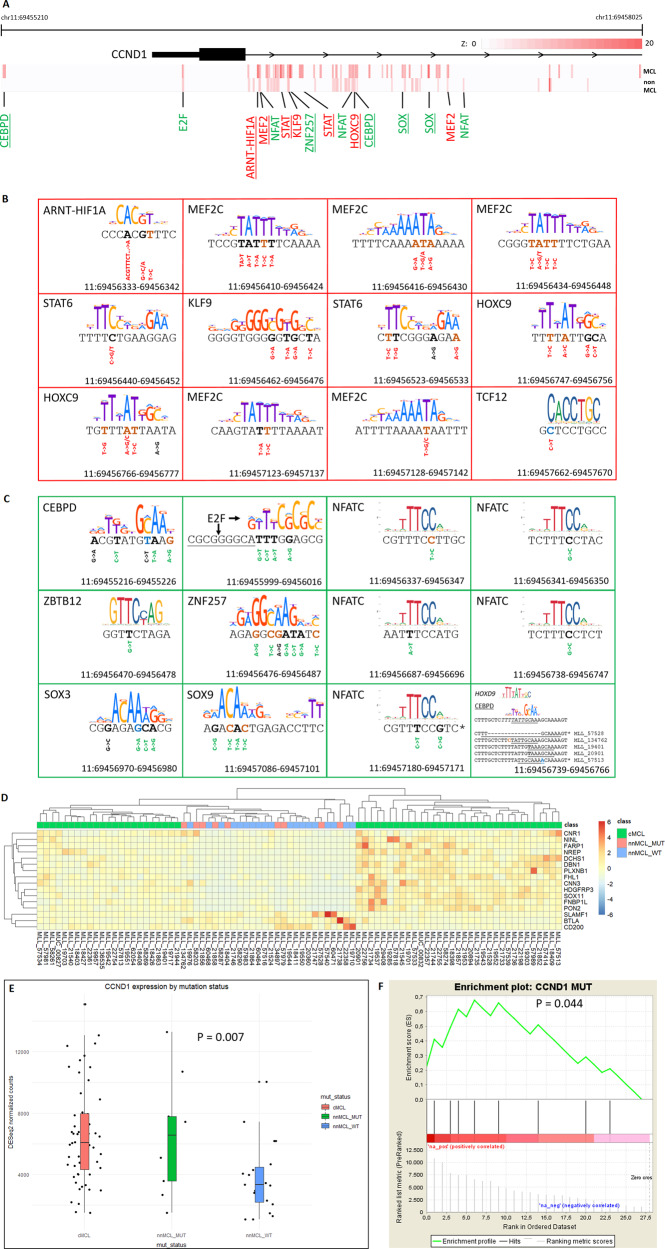
Fig. 4. MCL-specific enrichment of non-coding variants and their impact on transcriptional regulation of CCND1.
A Enrichment analysis of non-coding variants in the transcription regulatory region of the CCND1 locus. Analysis was performed using bins of size 5–10 bp. The maximum enrichment Z-score for the number of variants per bin is plotted for each base on a color scale for the MCL and the non-MCL samples. Motif searches were performed using either wild-type or mutated cluster sequence. Best matching motifs are indicated in green or red letters. Red letters indicate motif matches to the wild-type sequence. Green letters indicate motif matches to the mutated sequence. MCL-specific enrichment of clusters is marked by underlining the name of the matching motif. B, C Motif matches to enriched clusters. For each cluster, the cluster sequence and the best matching motif sequence logo are shown. Mutated bases are shown in bold. Brown and blue sequence letters indicate mutations matching c-AID and nc-AID sequence context, respectively. Genomic positions refer to hg19 coordinates. Motif matches to the wild-type cluster sequence are shown with red framing (B) indicating that the cluster is associated with destructive mutations. Green framing indicates that the cluster is subject to constructive mutations (C). Base changes for individual variants are shown underneath the sequence, in red for destructive mutations, in green for constructive mutations, and in black for neutral mutations with regard to the quality of the motif match. Reverse complemented genomic sequence is marked with a “*”. D Cluster analysis using the gene signature identified by [34] to classify MCL samples as cMCL or nnMCL. Gene expression levels are based on DESeq2 normalized counts. The criteria to further subclassify nnMCL samples as nnMCL_MUT or nnMCL_WT are described in the main text. E Wald test for differential expression of CCND1 mRNA depending on the mutation status of the transcription regulatory region of CCND1. F Gene set enrichment analysis for the mutation status of the transcription regulatory region of CCND1. A pre-ranked nnMCL sample list based on CCND1 expression levels as measured by DESeq2 normalized counts was used. Black bars indicate the rank of nnMCL_MUT samples.

