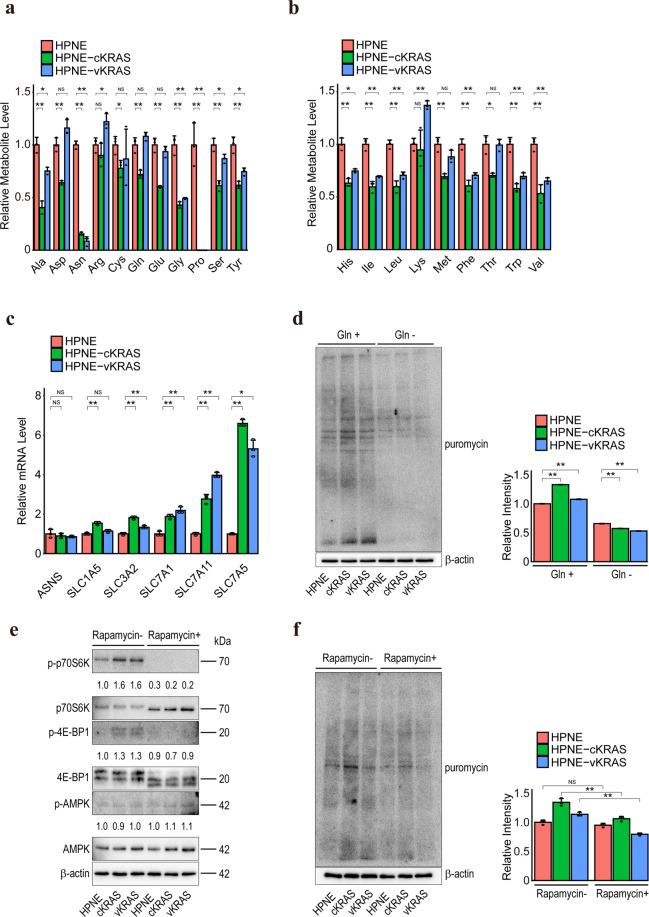
Fig. 4. Intracellular amino acid levels are decreased in KRAS mutant pancreatic epithelial cells.
a Intracellular non-essential amino acid levels. Results are the means of three biological replicates; error bars represent SD. NS, not significant; *p < 0.05; **p < 0.01. b Intracellular essential amino acid levels. Results are the means of three biological replicates; error bars represent SD. NS, not significant; *p < 0.05; **p < 0.01. c Relative mRNA levels of the indicated genes taking the levels in HPNE cells as 1. Results are the means of three biological replicates; error bars represent SD. NS, not significant; *p < 0.05; **p < 0.01. d Puromycin incorporation assay results. Cells were cultured in normal (Gln+) or glutamine-deficient (Gln−) medium for 24 h. Puromycin was added 10 min before sample collection and the lysates were subjected to Western blotting using an anti-puromycin antibody. Representative results from three independent experiments are shown. Relative total band intensities are shown at the right. Error bars represent SD. **p < 0.01. e mTOR pathway activity as determined by measuring the phosphorylation level of p70S6K and 4E-BP1 by Western blotting. Representative results from three independent experiments are shown. Band intensities are indicated below the images. f Puromycin incorporation assay results. Cells were treated with or without 100 nM rapamycin for 6 h. Puromycin was added 10 min before sample collection and the lysates were subjected to Western blotting using an anti-puromycin antibody. Representative results from three independent experiments are shown. Relative total band intensities are shown at the right. Error bars represent the SD. **p < 0.01. NS, not significant; **p < 0.01.

