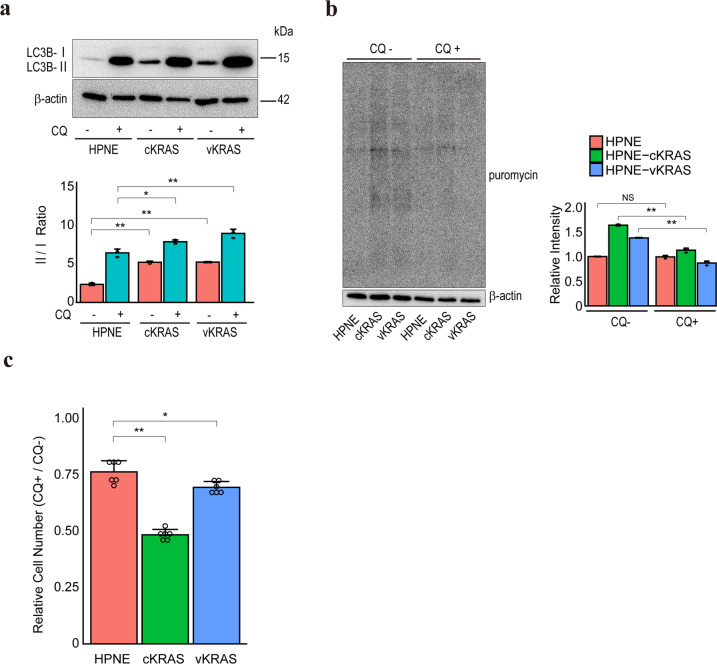
Fig. 5. Autophagy is required for maintaining KRAS mutant pancreatic epithelial cells.
a Autophagic flux levels as determined by Western blotting of LC3B-I and LC3B-II. Representative results from three independent experiments are shown. Band intensity ratios (LC3B-II/LC3B-I ratio) are indicated below the images. A lysosomal inhibitor, chloroquine (CQ), was used to assess autophagic flux by assessing the LC3B-II level. Error bars represent the SD. *p < 0.05; **p < 0.01. b Puromycin incorporation assay results. Cells were treated with or without 5 μM chloroquine for 4 h. Puromycin was added 10 min before sample collection. Representative results from three independent experiments are shown. Relative total band intensities are shown at the right. Error bars represent the SD. NS, not significant; **p < 0.01. c Cells were treated with 5 μM chloroquine for 48 h. The number of cells relative to the control (without treatment) was determined. Results are the means of six biological replicates; error bars represent the SD. *p < 0.05; **p < 0.01.

