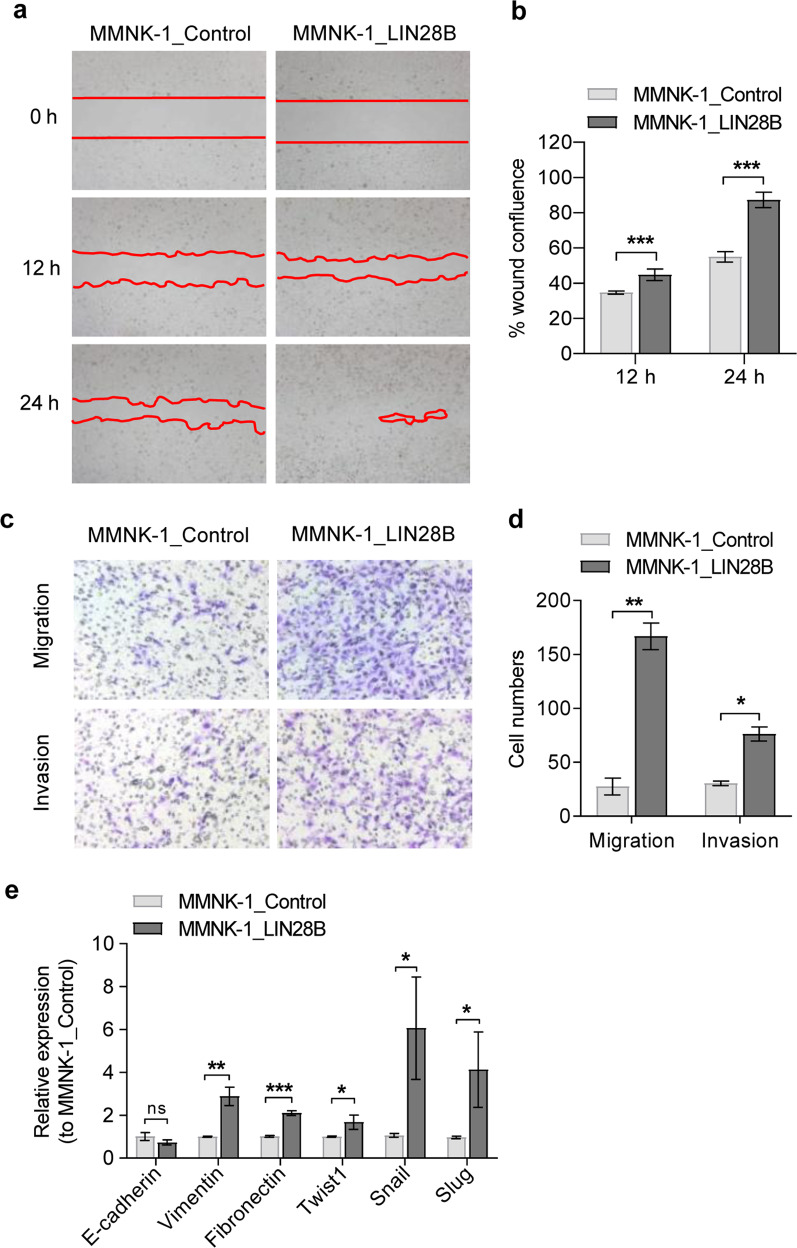
Fig. 3. LIN28B promotes epithelial–mesenchymal transition in MMNK-1 cells.
The images show control and LIN28B at 0, 12 and 24 h after scratching. The red line indicates the wound gap and shows the line drawn for image analysis (a). The percentage of wound confluence was normalised to the starting point, 0 h (b). Quantification of cell migration and invasion was performed using a Boyden chamber assay. After incubation for 20 h, representative images of cells stained with crystal violet are shown for migrated and invaded cells (c), and the cell numbers were quantified (d). Relative expression of the epithelial and mesenchymal genes E-cadherin, Vimentin, Fibronectin, Twist1, Snail and Slug in LIN28B-overexpressing cells (e). Bar graph indicated as the mean ± SD, n = 3. Statistical significance is indicated by *P < 0.05; **P < 0.01; ***P < 0.001.

