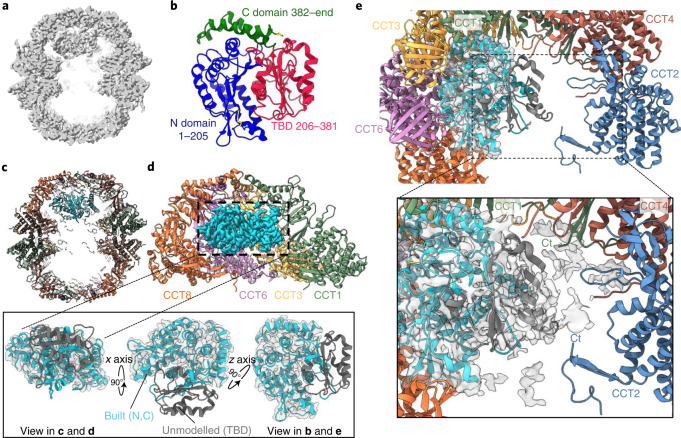
Fig. 2. TRiC–tubulin complex.
a, Side slice map for closed TRiC, showing substrate density within one cavity of the chamber. b, Topology of native β-tubulin (PDB 6I2I). c, Overall model of TRiC–tubulin complex. d, Slice of the CCT8–CCT6–CCT3–CCT1 hemisphere from one ring, in contact with the substrate density (cyan). Inset, three orthogonal views showing region of β-tubulin built into the substrate density (cyan). Unmodeled TBD from tubulin (dark gray) is shown for reference. e, Top-down view of chamber interior, with tubulin density (cyan) adjacent to one hemisphere, and space in the interior that can accommodate the unmodelled TBD. Inset, at lower isosurface threshold, substrate density (gray surface) can accommodate the TBD (dark gray, taken from PDB 6I2I), which extends towards the C termini of CCT1 and CCT2.

