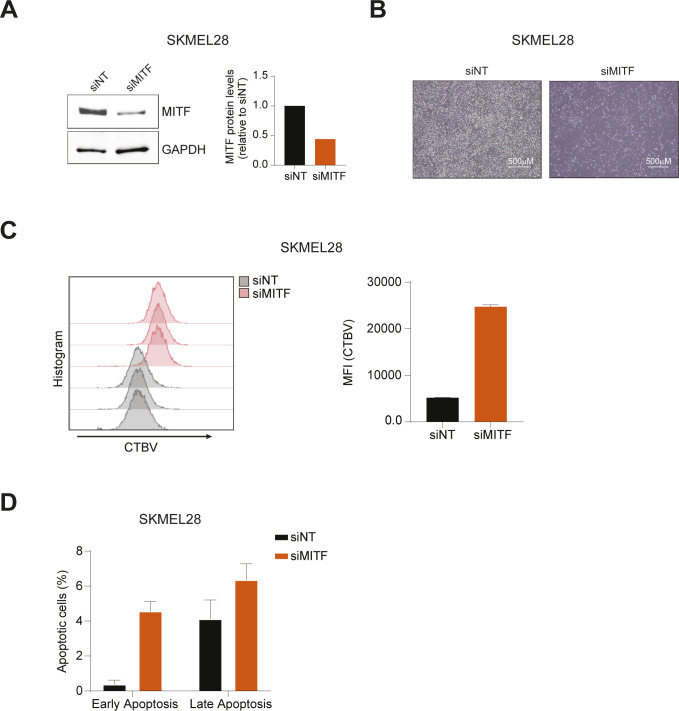
Figure S5. Analysis of cell proliferation and cell death upon MITF knockdown.
(A) SKMEL28 was transfected with siRNA against MITF (siMITF) or nontargeting control (siNT). After 48 h, cell lysates were analyzed by Western blot. Band intensities were quantified by ImageJ software, and the MITF/GAPDH ratio is indicated of the blot shown. (B) Phase-contrast images are shown depicting cell confluence and morphology 7 d after the transfection. (C) Transfected cells were stained with Cell Tracer Violet (CTBV) and analyzed by CTBV incorporation the same day of the staining (day 0) or after 7 d (day 7). The CTBV incorporation at day 7 is shown. Histogram indicates mean fluorescence intensity (MFI) of siNT and siMITF transfected cells at day 7. Data represent mean ± SEM of four technical replicates. (D) Cell death was assayed by Annexin V and Zombie stainings. Early apoptosis indicates the percentage of Annexin V+/Zombie− cells, whereas late apoptosis shows the percentage of Annexin V+/Zombie+ cells. Data represent mean ± SEM of four technical replicates.
Source data are available for this figure.

