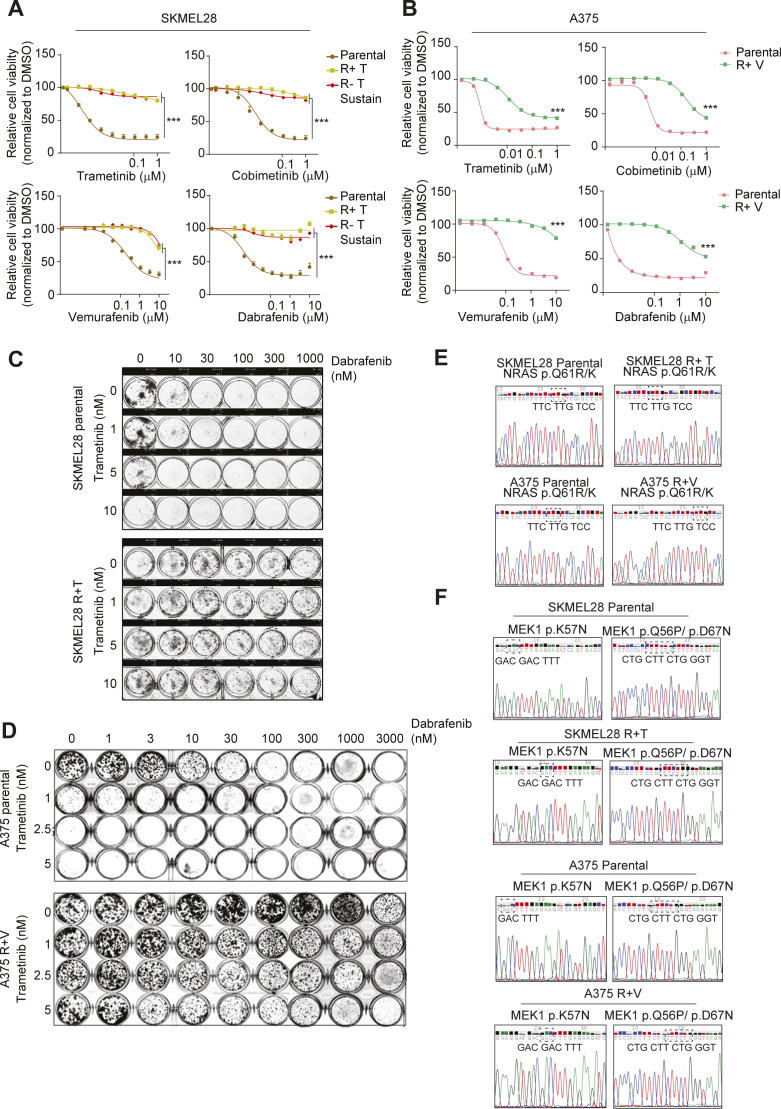
Figure S7. SKMEL28 and A375 MAPKi resistance profile.
(A, B) SKMEL28 (A) and A375 (B) cells were seeded in the absence of MAPKi and 24 h later were treated with the different MAPKi at increasing concentrations for 72 h before assessment of viability by CellTiter-Glo 2.0. Data are normalized to DMSO and represents mean of three independent experiments. Statistical significance denotes difference between the highest concentration of resistant cells versus parental cells. (C, D) SKMEL28 (C) and A375 (D) cells were seeded and 24 h later treated with increasing concentrations of trametinib and dabrafenib. Cell viability was analyzed by colony formation assay. (E, F) Genomic DNA was isolated from SKMEL28 and A375 parental and resistant cells. (C) NRAS exon 3 was sequenced and analyzed for Q61R/K mutation (c.182A > G). (D) MEK1 exon 2 was sequenced and analyzed for K57N (c. 171 G>T), Q56P (c.167A > C) and D67N (c.199 G>A) mutations. WT sequences are shown in all panels.

