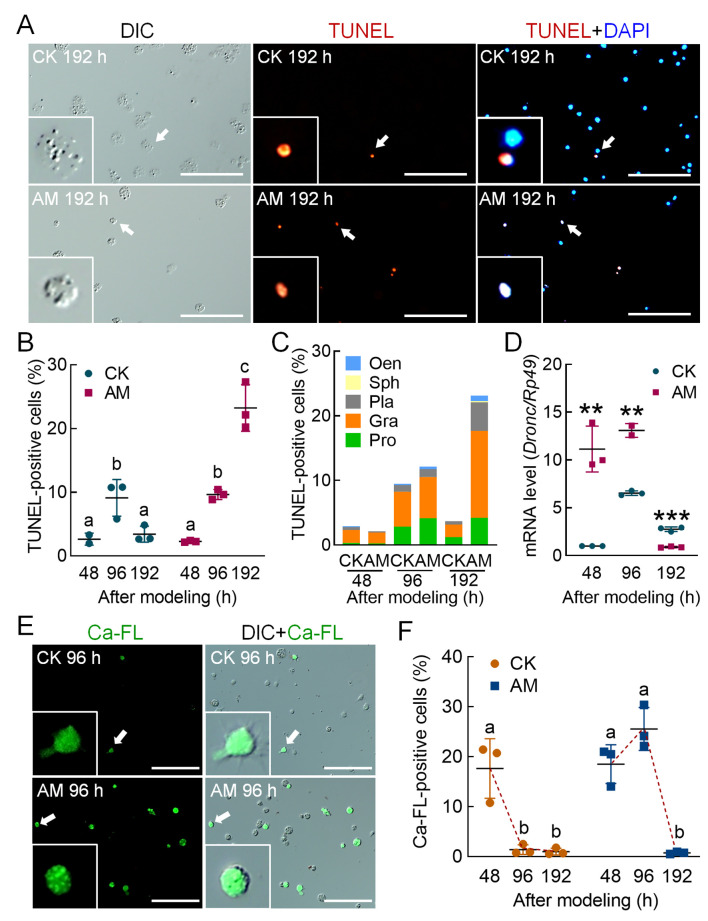
Figure 3.
HPPC induced apoptosis of circulating hemocytes (blood cells) via endoplasmic reticulum-calcium ion release signaling pathway
TUNEL and Ca-FL staining show hemocytes with apoptosis and elevated cytoplasmic calcium level, respectively, in hemolymph at 48, 96, and 192 h after modeling, and DAPI shows hemocyte nuclei. Positive rate (%)=(fluorescent cell number/total cell number)×100. Scale bars: 100 μm. A: TUNEL-stained fluorescence image at 192 h after modeling. B: TUNEL staining positive rate of hemocytes. C: TUNEL staining positive rate of different types of hemocytes. D: Transcription level of apoptosis-initiating gene Dronc analyzed by qPCR, with internal reference gene Rp49 (n=3). E: Ca-FL-stained fluorescence image of hemocytes at 96 h after modeling. F: Positive rate of hemocyte Ca-FL staining. In Figure 3B, F, significant differences between groups are indicated with different letters. Data are mean±SEM, P≤0.05, n=3. In Figure 3D, data are mean±SEM. *: P<0.05;**: P<0.01;***: P<0.001, Student’st-test.

