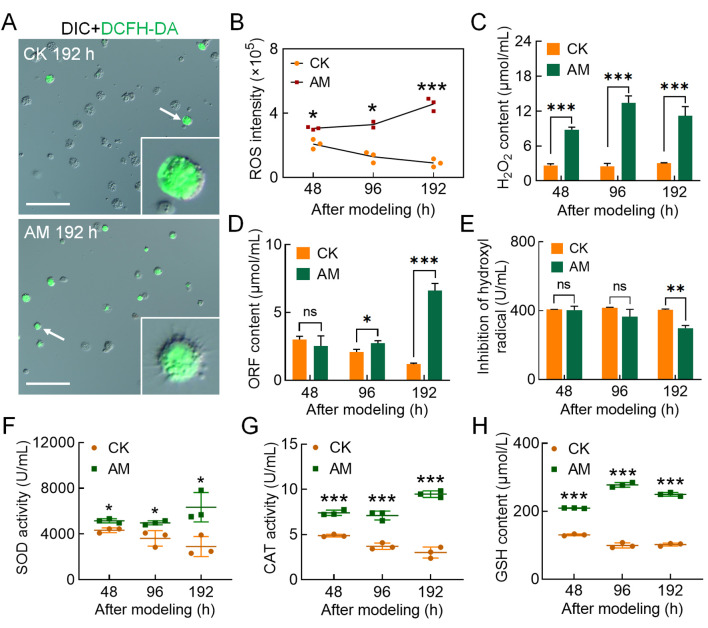
Figure 4.
HPPC increased oxidative stress in hemocytes
DCFH-DA staining of ROS in hemocytes at 48, 96, and 192 h after modeling. Scale bars: 100 μm. A: DCFH-DA-stained fluorescence image at 96 h after modeling. B: Relative level of ROS in circulating hemocytes. Fluorescence intensity was calculated using Image Pro software, relative ROS intensity (×105)=fluorescence intensity/total hemocytes count. C–E: Three main components of ROS in plasma. C: H2O2 content; D: Superoxide anion (OFR) content; E: Hydroxyl radical (∙OH) inhibition ability. F–H: SOD and CAT activity and GSH content in plasma. A–H,n=3. Data are mean±SEM. ns: P>0.05;*: P<0.05;**: P<0.01;***: P<0.001, Student’st-test.

