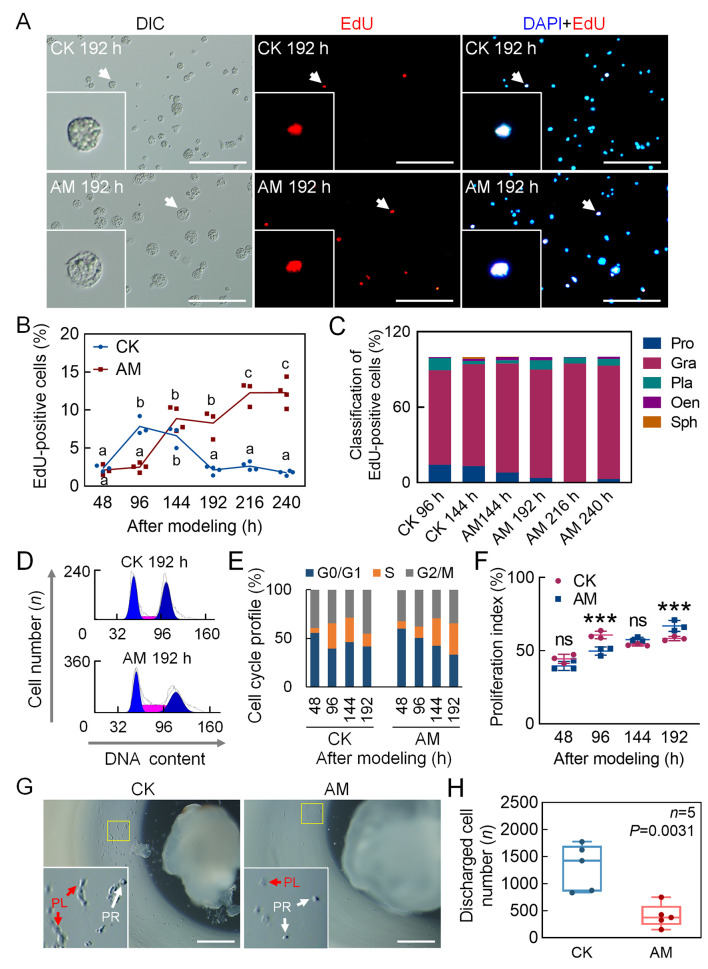
Figure 5.
Hyperproteinemia delayed proliferation of hemocytes in later stages of modeling
A–C: DNA staining of proliferating hemocytes. EdU and DAPI staining marked proliferating cell nuclei and all cell nuclei, respectively, in hemolymph at 48, 96, 144, 192, 216, and 240 h after modeling. Positive rate (%)=(EdU-positive cell number/DAPI-positive cell number)×100. Scale bars: 100 μm. A: EdU staining fluorescence at 192 h after modeling. B: EdU-positivity rate in hemocytes (CK 48–240 h, n=3, 3, 3, 4, 4, 4; AM 48–240 h, n=3, 4, 4, 3, 3, 4. P≤0.05). Significant differences between groups are indicated with different letters. C: Composition of EdU-positive blood cells. Positive rate (%)=(number of EdU-positive blood cells of same type/total number of EdU-positive cells)×100. D: PI-FCM detected cell cycle phase of circulating hemocytes (n=3). Cell cycle was divided into G0/G1, S, and G2/M phases. E: Quantitative diagram of cell cycle phases. Ordinate indicates proportion of cells in G0/G1, S, and G2/M phases to total number of cells. F: Proliferation index (PI) (n=3), indicating proportion of proliferating hemocytes to total number of circulating hemocytes. PI (%)=(S+G2/M)/(G0/G1+S+G2/M)×100. Data are mean±SEM. ns: P>0.05;***: P<0.001, Student’st-test. G, H: Culture HPO-wing disc complex in vitro. After 24 h of modeling, HPO-wing disc complex was removed, and level of hematopoiesis was investigated after 48 h of culture in vitro. PR, Prohemocytes. PL, Plasmatocytes. G: HPO-Wing morphology. Scale bars: 0.5 mm; H: Number of hemocytes released by single culture of HPO-wing disc complex (n=5). Data are mean±SEM. Significant P-values were calculated by Student’s t-test.

