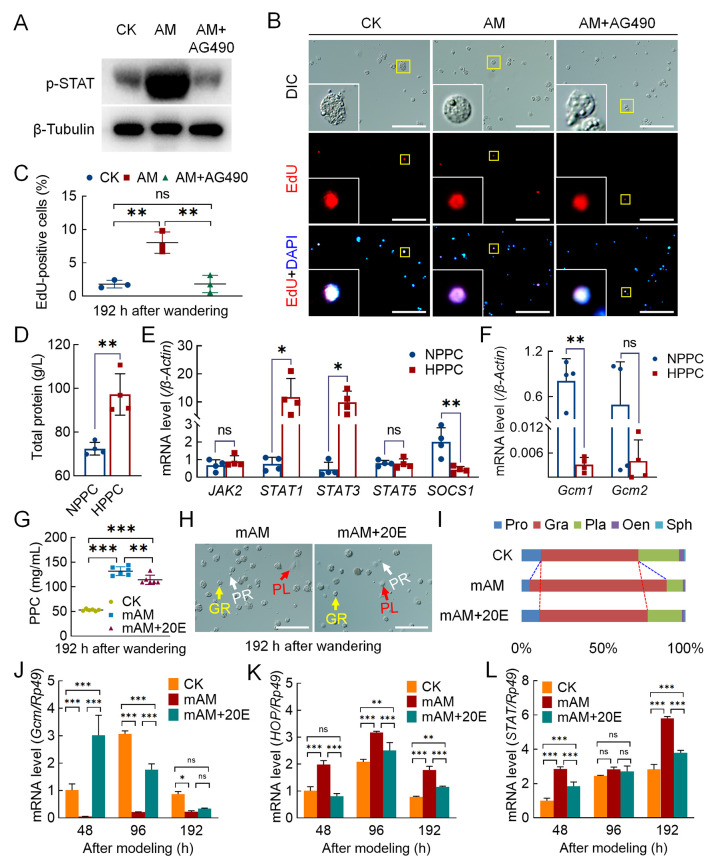
Figure 7.
Endocrine hormone treatment of hyperproteinemia affected hemocyte proliferation and differentiation
A–C: EdU staining was used to investigate hemocyte proliferation after injection of JAK inhibitor A490 (n=3). AM+AG490, AM group injected with AG490 (50 μmol/10 μL) at 144 h after modeling, with hemolymph samples then collected at 192 h. A: Level of phosphorylated-STAT protein was analyzed by western blotting. B: EdU-stained fluorescence image. C: EdU-positivity rate in blood cells. Scale bars: 100 μm. D–F: Investigation of JAK/STAT pathway and Gcm gene transcription in peripheral blood of patients with HPPC (n=4). NPPC, patients with normal total protein levels in clinical cases; HPPC, patients with total protein levels outside normal range in clinical cases. D: Total protein level, reference value 65–85 g/L. Transcription levels of JAK/STAT pathway (E) and Gcm-related genes in hemocytes (F) were analyzed by qPCR. Internal reference gene was Homo sapiens β-Actin. G–I: Percentage of hemocytes in mAM group after 20E rescue. CK, control; mAM, mild model; mAM+20E, 20E was injected at 24 h after mAM modeling, and hemolymph samples were collected at 144 h after injection (corresponding to 192 h after AM group modeling). G: PPC level (n=5). H: Circulating hemocyte image. PR, Prohemocytes; PL, Plasmatocytes; GR, Granulocytes. Scale bars: 100 μm. I: Percentage composition of circulating hemocytes. J–L: Transcription levels of related genes in mAM group after 20E rescue (n=3) were analyzed by qPCR. Internal reference gene was Bombyx mori Rp49. mAM+20E, mAM group was injected with 20E at 0 h after modeling. J: Gcm; K: HOP; L: STAT. Data are mean±SEM. ns: P>0.05;*: P<0.05;**: P<0.01;***: P<0.001, Student’st-test.

