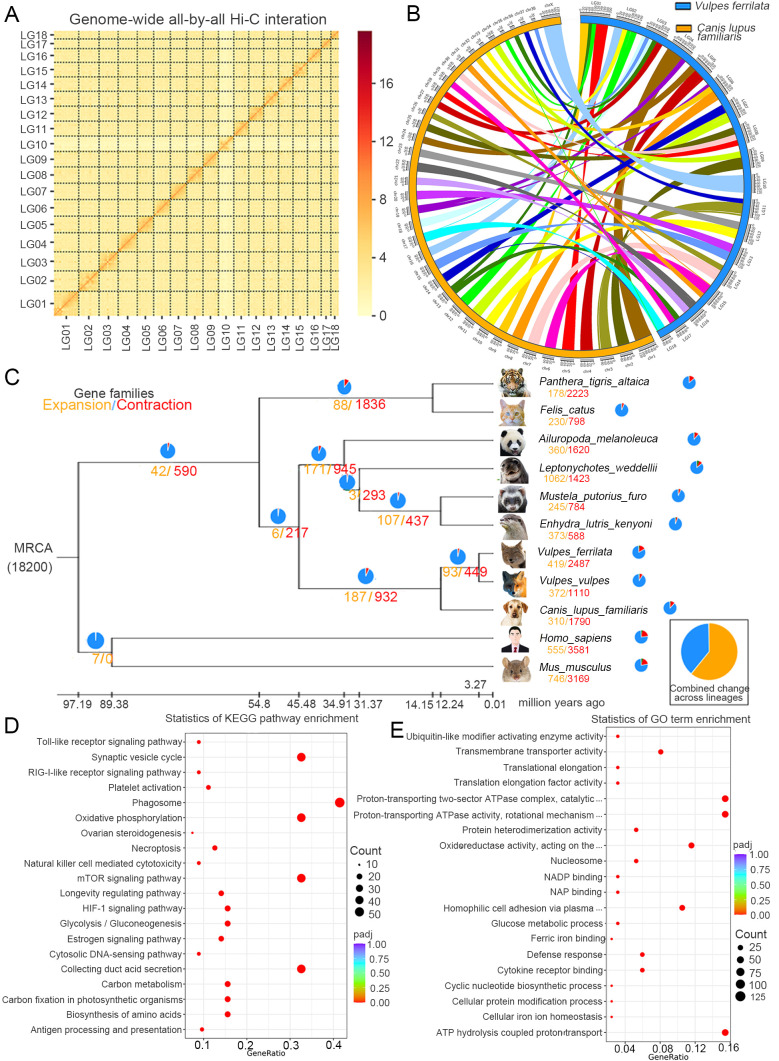
Figure 1.
Statistics and data analysis of genome assembly of Vulpes ferrilata
A: Genome-wide all-by-all Hi-C interaction identified 18 linkage groups. B: Synteny analysis of V. ferrilata and Canis lupus familiaris genomes. C: Gene family evolution between genomes of V. ferrilata and 10 other species, orange and red numbers indicate gene family expansions and contractions, respectively. Length of branch indicates divergence time. MRCA: Most Recent Common Ancestor. Ma: Million years ago. D: Significant KEGG enrichment in expanded gene families. Value around each bar indicates number involved in each KEGG pathway. E: GO classification of expanded gene families, including top 20 significant GO categories (P<0.05). BP: Biological process; CC: Cellular component; MF: Molecular function.

