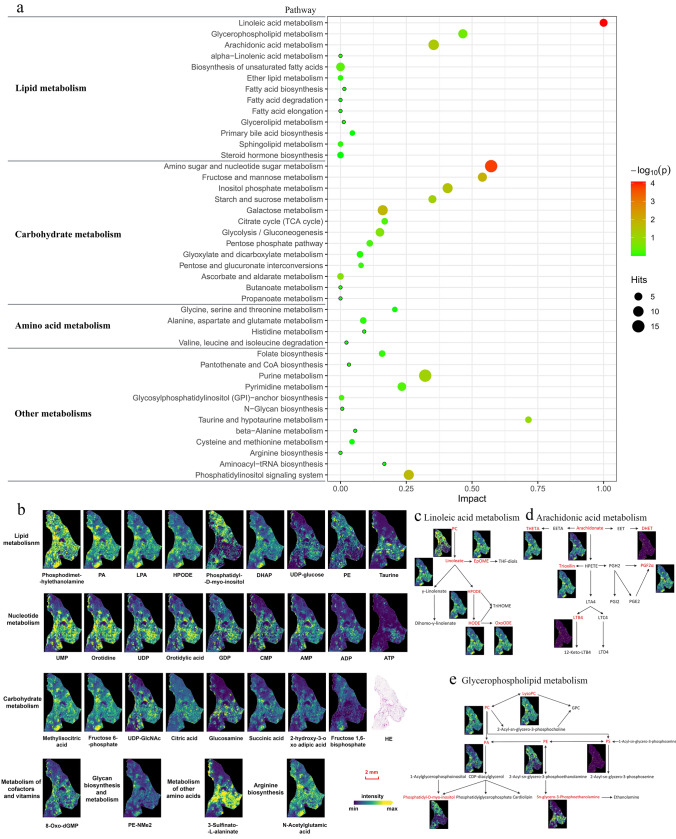
Fig. 4.
Pathway enrichment analysis of metabolites detected in WAT with 30-s filter paper application. a A broad range of metabolites involved in lipid, carbohydrate, amino acid, and other pathways were simultaneously detected in the tissue with 30-s filter paper application. Metabolic pathways are represented as circles according to their metabolic classifications as well as scores from enrichment (vertical axis) and topology analyses (pathway impact, horizontal axis). The color of circles indicates the statistical significance of the overall metabolic changes within the pathway, and circle diameter represents the relative impact of differential metabolites within the pathway as indicated. Pathway impact is a combination of the centrality and pathway enrichment results. It is calculated by adding up the importance measures of each of the matched metabolites and then dividing by the sum of the importance measures of all metabolites in each pathway. b Visualization images of representative species in multiple pathways. c–e show the detected metabolites (red) in the metabolic pathways of linoleic acid, arachidonic acid, and glycerophospholipid, which are top three in lipid metabolism. (WAT white adipose tissue, a.i. arbitrary intensity, PA phosphatidic acid, PC phosphatidylcholine, PE phosphatidylethanolamine, PG phosphatidylglycerol, PI phosphatidylinositol, PS phosphatidylserine, LysoPA lysophosphatidic acid, CPA cyclophosphamide, AMP adenosine monophosphate, ATP adenosine triphosphate, ADP adenosine diphosphate, GMP guanosine monophosphate, UDP uridine diphosphate glucose, DGTS diacylglyceryltrimethylhomoserines)

