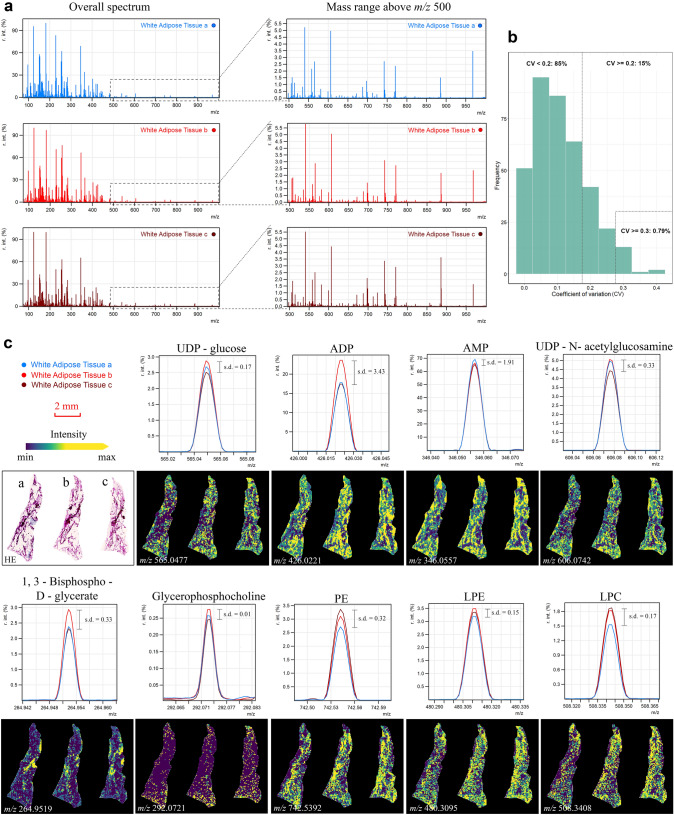
Fig. 5.
Technical reproducibility of the optimized workflow with 30-s filter paper application. Three serial WAT sections from one mouse were treated with 30-s filter paper and measured at a spatial resolution of 60 µm. a Overall (left) spectra and mass range above m/z 500 (right) for each triplicate. b For the majority of m/z species’ intensities in triplicate replications, CVs were below 0.2 and less than 1% of CVs were above 0.3. y-axis, the frequencies of annotated m/z species from triplicates; x-axis, the CV values. The dashed line indicates CV = 0.2/0.3 for comparison references. c The s.d. of typical endogenous molecules from three WAT sections were calculated and the corresponding optical images (of maximal peak intensities) were visualized. (WAT white adipose tissue, PE phosphatidylethanolamine, LPE lysoPE (lysophosphatidylethanolamine), LPC lysoPC (lysophosphatidylcholines), r. int. (%) relative intensity threshold, CV coefficient of variation, s.d. standard deviation)

