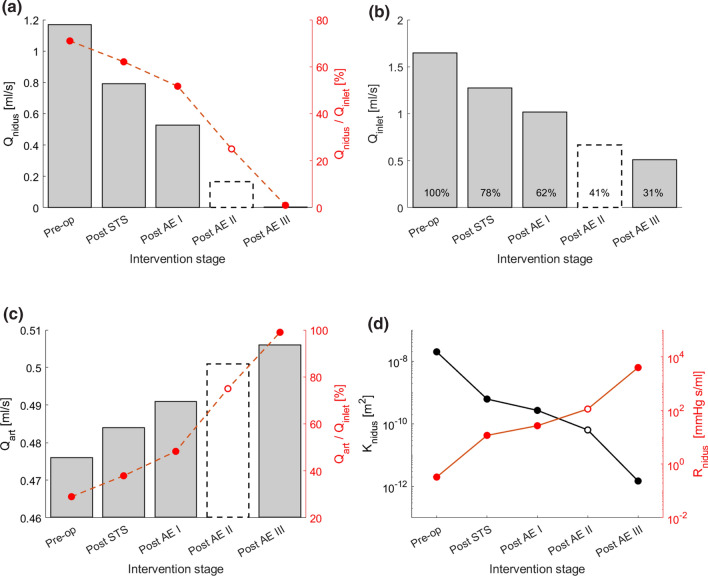
Figure 6.
(a, b, c) The charts show the haemodynamic changes predicted by the computational model at the different stages of the sclerotherapy intervention in terms of (a) flow rate through the nidus (Qnidus), (b) inlet flow rate (Qinlet), (c) flow rate via the arterial outlet (Qart). (d) Nidus permeability (K) and corresponding hydraulic resistance (Rnidus) at the different intervention stages. The results for the Post AE II stage are reported with a dashed line because, due to the lack of DSA images, the Post AE II model parameters were estimated via interpolation of the other stages rather than calibrated with clinical data.

