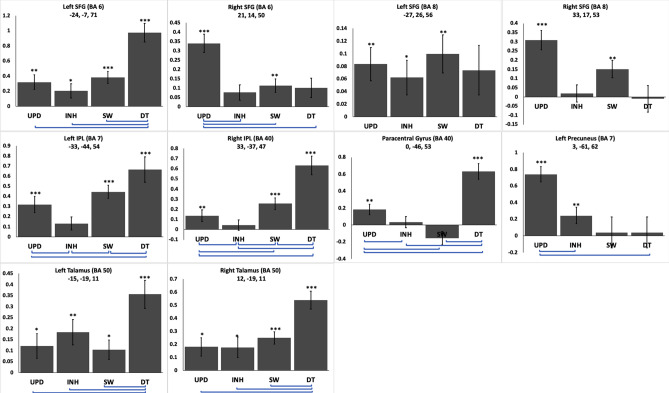
Figure 3.
Areas of relative diversity. Each panel corresponds to a coordinate in Table 2. The bars reflect the average beta-values at this coordinate in the respective EF contrasts (e.g., INH – CT3 or DT – CT1 – CT2). Asterisks over each bar indicate significant positive activation in the corresponding task (one-sample t-test vs 0; *p < 0.05; **p < 0.01; ***p < 0.001). Error bars denote SEM. Horizontal lines below the x-axis indicate significant differences between the connected conditions (paired-sample t-tests, p < 0.05). Note the different scales.

