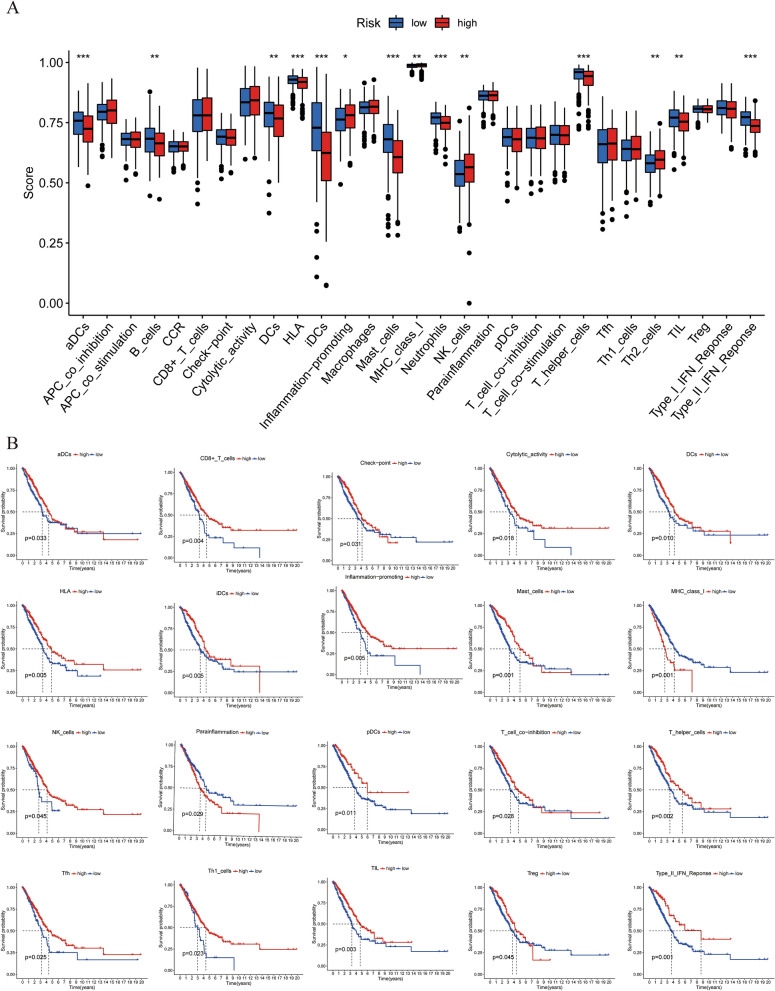
Figure 10.
Immune characteristics of the IGSPP subgroups. (A) Immune-related functions were enriched and analyzed by ssGSEA and then compared among different IGSPP subgroups. The scattered points represent the ssGSEA scores of the two subgroups, the horizontal line represents the median, and the bottom and top of the box represent the 25th and 75th percentiles (quartile intervals), respectively. The Wilcoxon test was used to evaluate the difference between two subgroups (*p < 0.05, **P < 0.01, ***P < 0.001). (B) Correlation between immune-related function score and overall survival time.

