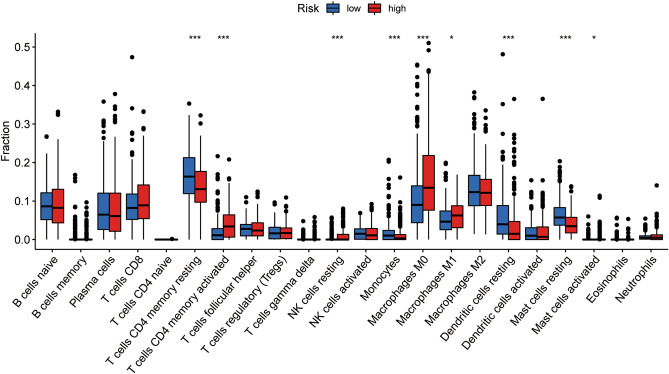
Figure 9.
Immune cell infiltration in the IGSPP subgroups. Infiltration abundance of 22 immune cells in the IGSPP subgroups. Blue represents the low-risk group of IGSPP, and red represents the high-risk group. The horizontal line represents the median, and the bottom and top of the box are the 25th and 75th percentiles (quartile intervals), respectively. The Wilcoxon test was used to evaluate the differences between the two subgroups (*P < 0.05, **P < 0.01, ***P < 0.001, ****P < 0.0001).

