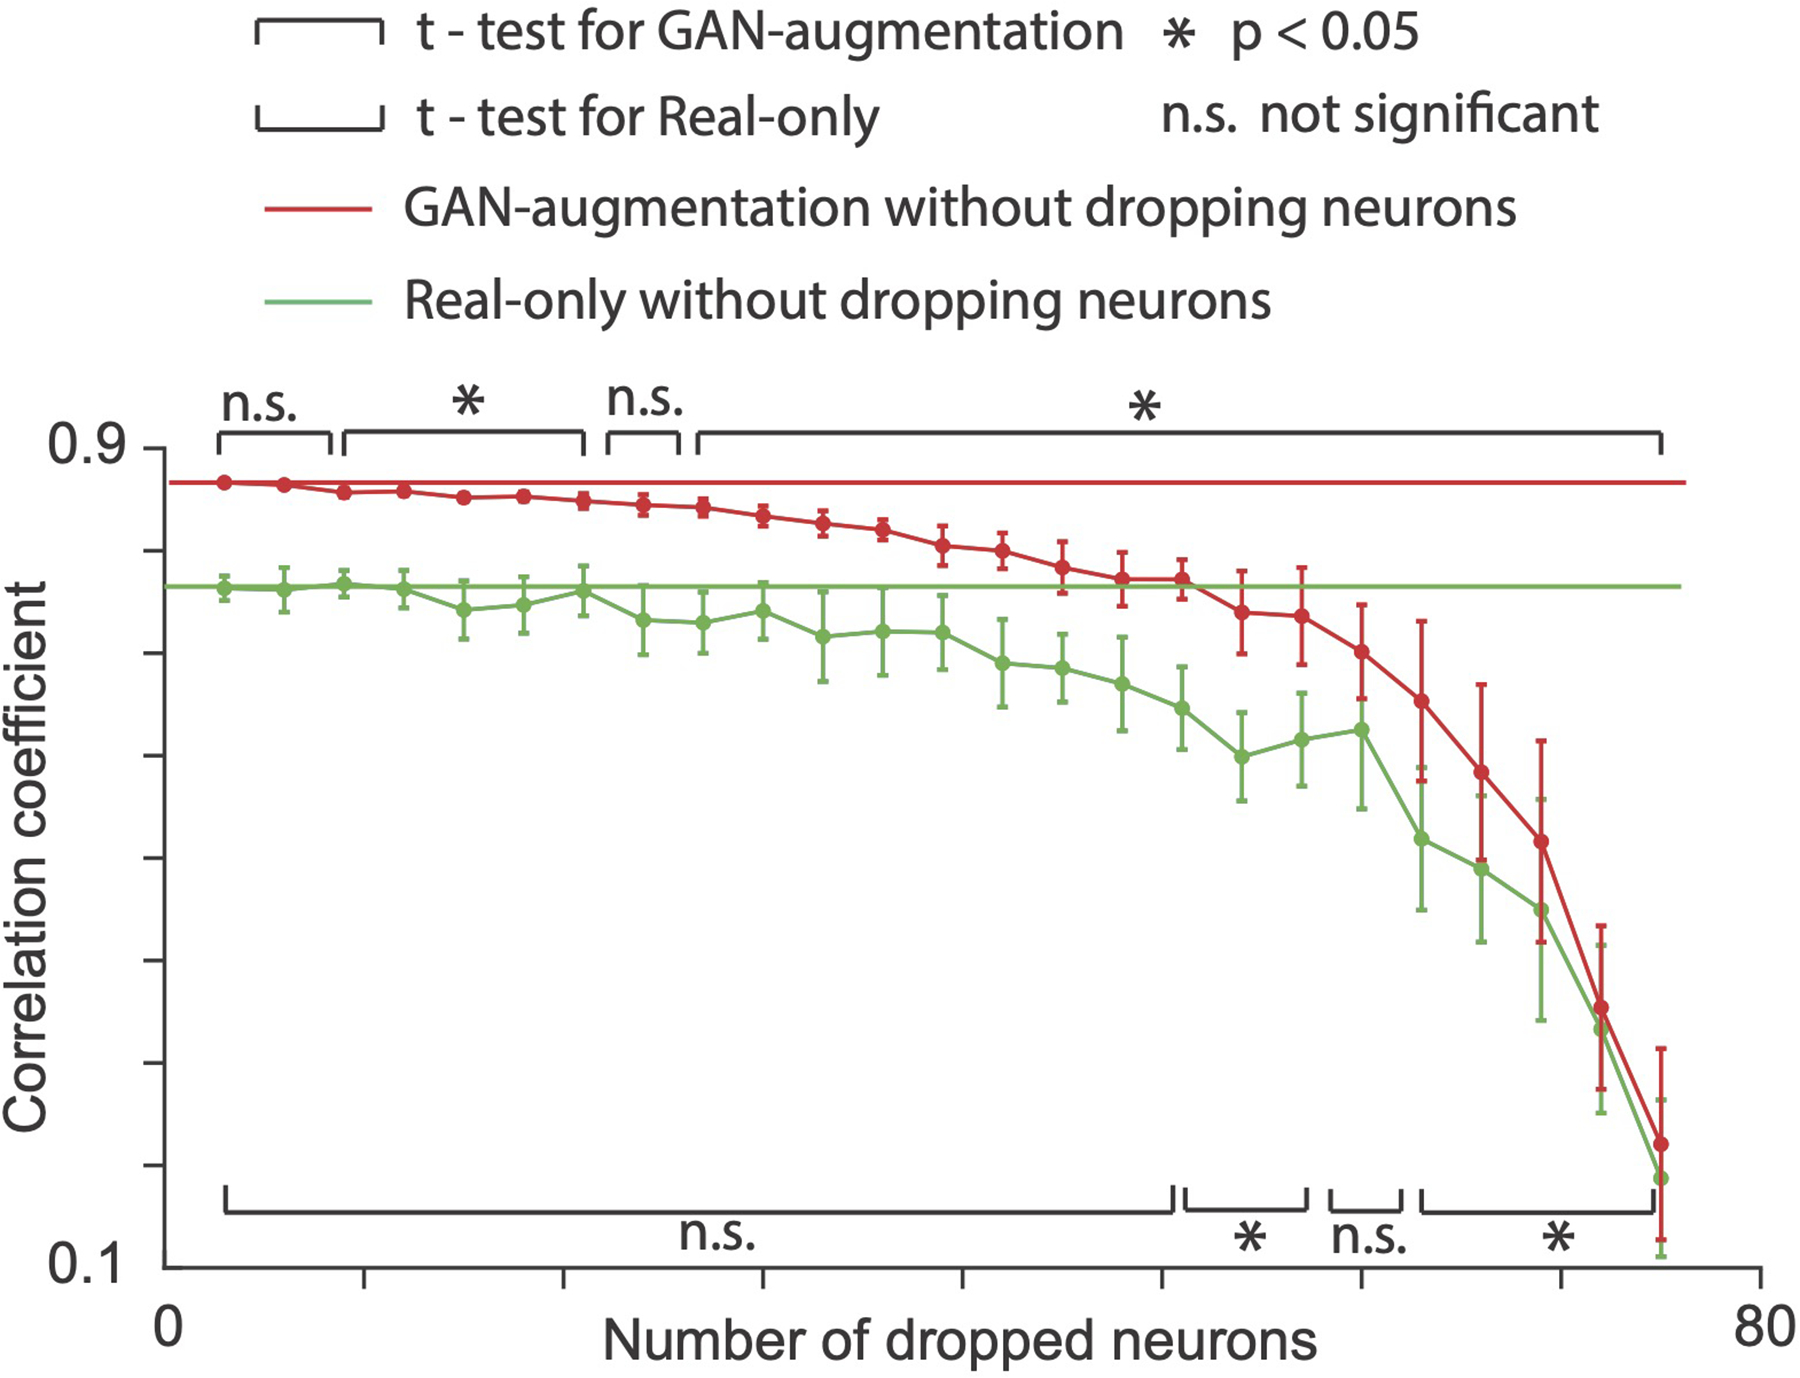
ED Fig. 5. Averaged performance for cross-session decoding (11.73 minutes of neural data from S.2, M.C, which is the amount required for real-only to achieve good performance) on GAN-augmentation (red curve) and real-only (green curve) methods with increasing number of dropped neurons.

We randomly dropped neurons each time and repeated 10 times for each number of dropped neurons (mean + / − S.D., sample number = 10). P-values (t-test) for the GAN-augmentation method for all data points from left to right are [0.577, 0.130, 0.035, 0.040, 0.002, 0.012, 0.030, 0.054, 0.018, 0.009, 0.010, 0.001, 0.012, 0.004, 0.010, 0.006, 0.001, 0.014, 0.026, 0.007, 0.027, 0.011, 0.007, 0.0001, 9.74 * 10−5]. P-values for the real-only method for all data points from left to right are [0.973, 0.933, 0.774, 0.948, 0.487, 0.576, 0.909, 0.396, 0.306, 0.458, 0.326, 0.368, 0.279, 0.135, 0.050, 0.081, 0.021, 0.005, 0.012, 0.122, 0.008, 0.005, 0.0214, 0.0007, 5.17 * 10−5].
