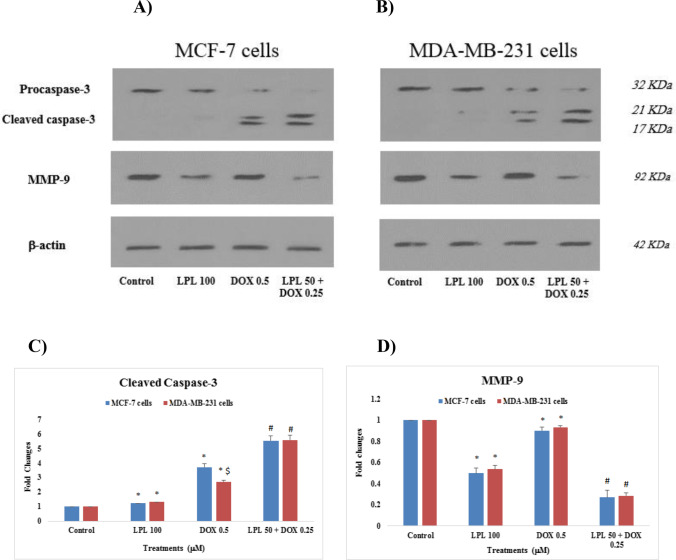
Fig. 5.
Effects of LPL and DOX on the expression of Caspase-3 and MMP-9 at protein level in: A: MCF-7 and B: MDA-MB-231 cells; The densitometry results, which normalized based on the expression of β-actin are represented for cleaved caspase-3 (C) and for MMP-9 (D); Asterisks are representing a significant difference between the control and treated cells and # is demonstrating a significant difference between mono-therapy and combination therapy (p < 0.05)

