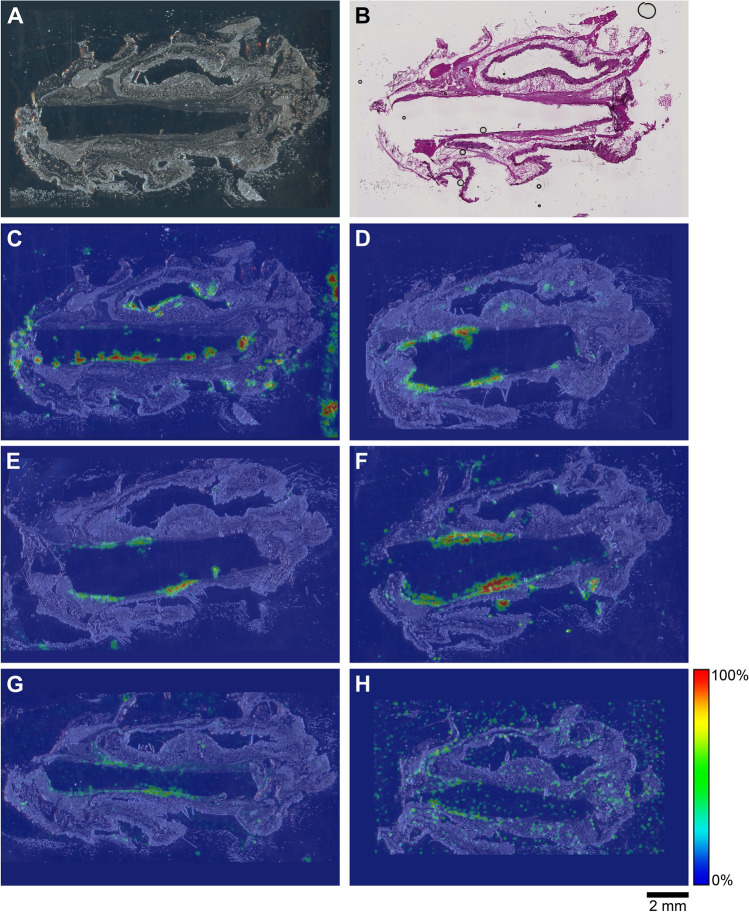
Figure 10.
Representative TAF and drug metabolite spatial distribution profiles in mouse dermal tissue sections adjacent to low-releasing (0.23 mg d-1) TAF implants, with the implants remaining in situ within the encasing tissue block excised at necropsy, on study Day 14. (A) Light microscopy image of the tissue section. (B) H&E Serial section stain of matching tissue specimen. (C–H) Overlay of mass spectrometry images, generated at a spatial resolution of 100 µm, and light microscopy images of the tissue specimens. (C) TAF; (D) Metabolite X; (E) Metabolite Y; (F) TFV; (G) TFV-MP; and (H) TFV-DP. Color key in the legend indicates relative ion abundance, with red representing the highest signal intensity (100%) and blue representing the lowest signal (0%) for the corresponding measured ion; all images were scaled individually. Scale bar, 2 mm.

