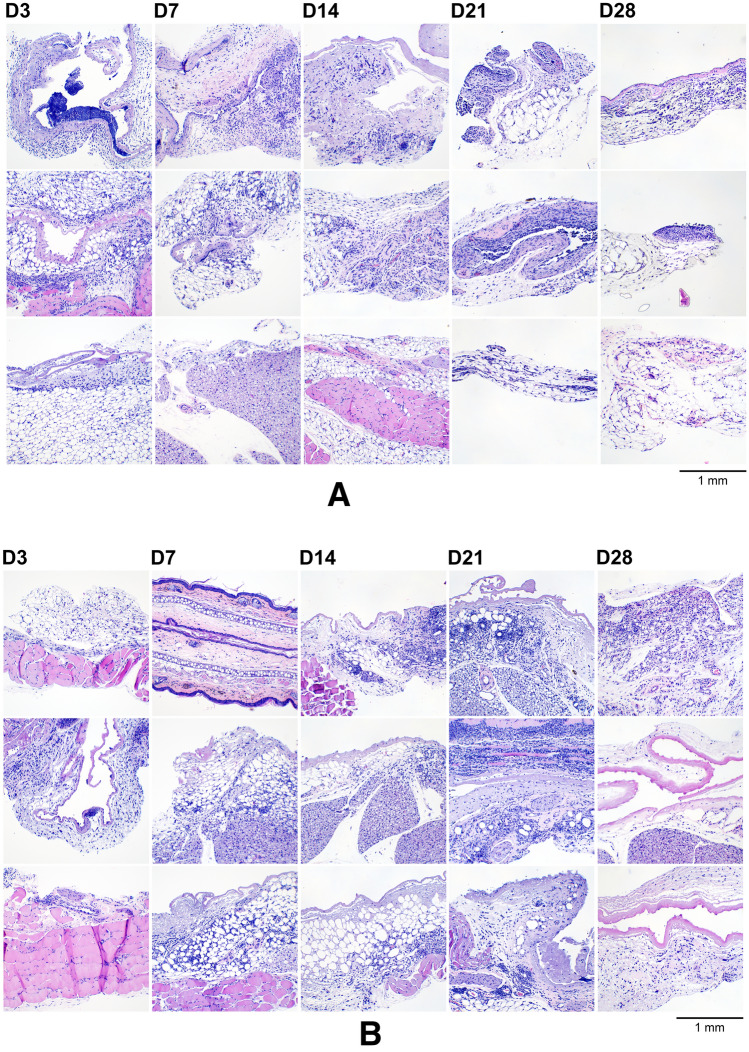
Figure 12.
(A) Dermal tissues collected adjacent to the TAF implant from the low-releasing group, aldehyde-fixed, paraffin-embedded, sectioned, and H&E-stained. The specimens span the 28-day period where the implants were in place and representative samples from all animals (N = 3 per timepoint) are included; D3, D7, D14, D21, and D28 indicate tissue specimens collected with the TAF implant in place at study days 3, 7, 14, 21, and 28, respectively. Scale bar, 1 mm. (B) Dermal tissues collected adjacent to the TAF implant from the high-releasing group, aldehyde-fixed, paraffin-embedded, sectioned, and H&E-stained. The specimens span the 28-day period where the implants were in place and representative samples from all animals (N = 3 per timepoint) are included; D3, D7, D14, D21, and D28 indicate tissue specimens collected with the TAF implant in place at study days 3, 7, 14, 21, and 28, respectively. Scale bar, 1 mm.

