Figure 3.
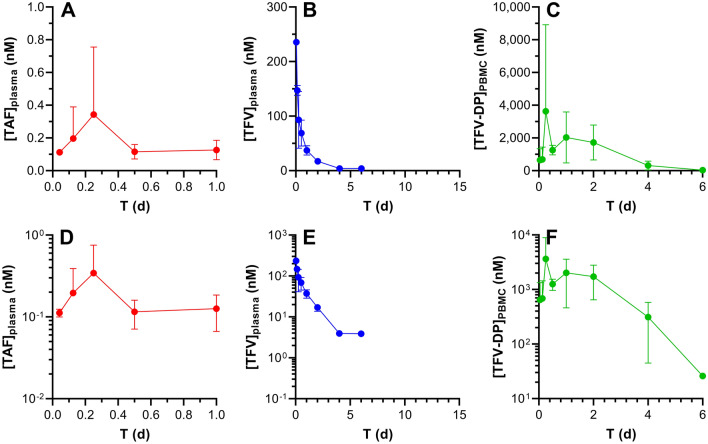
Subcutaneous TAF injection in C57BL/6 J mice results in different pharmacokinetics across the three key analytes. The data are shown as linear (A–C) and semilog (D–F) plots and all concentration units are represented in nanomolar (nM) for ease of comparison. Concentration–time profiles of plasma TAF (A and D; red circles), plasma TFV (B and E; blue circles), and PMBC TFV-DP (C and F; green circles) are shown as means ± SD (N = 4 per group). The assay LLOQs are: TAF, 0.06 nM (0.03 ng mL-1); TFV, 3.5 nM (1 ng mL-1); TFV-DP, 5 nM (based on 5 fmol/sample, and a median of 5.0 × 10⁶ PBMCs per sample).

