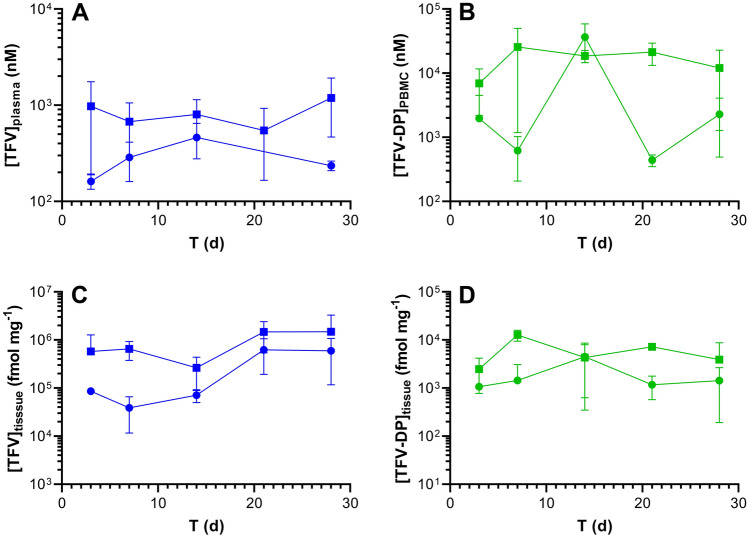
Figure 5.
Subdermal placement of TAF implants in C57BL/6 J mice maintains sustained drug concentrations. Data are presented as means ± SD (N = 3 per timepoint); circles, low-releasing implants (0.28 mg d-1 in vivo); squares, high-releasing implants (0.58 mg d-1 in vivo). Pharmacokinetic profiles of (A) plasma TFV; (B) PBMC TFV-DP; (C) dermal tissue (collected adjacent to the implant) TFV; and (D) dermal tissue TFV-DP. The assay LLOQs are: plasma TFV, 3.5 nM (1 ng mL-1); PBMC TFV-DP, 13 nM (based on 5 fmol/sample, and a median of 1.9 × 10⁶ PBMCs per sample); tissue TFV 21 fmol mg-1 (based on 0.05 ng/sample, and a median of 8.4 mg per sample); tissue TFV-DP 0.6 fmol mg-1 (based on 5 fmol/sample, and a median of 8.4 mg per sample).

