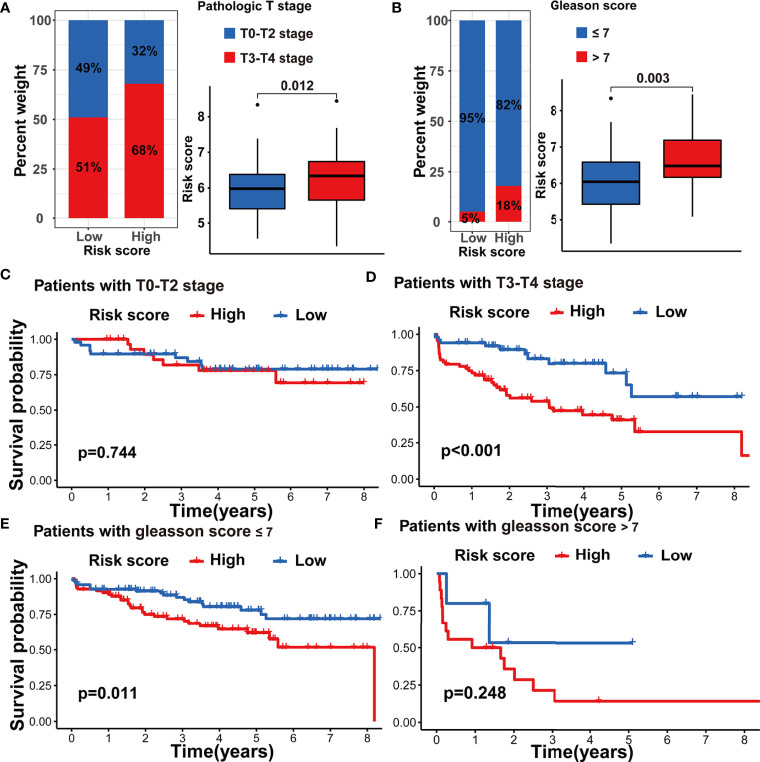
Figure 10.
Validation of m5C modification signature in the testing dataset. (A) The analysis on the association between the risk score and pathologic T stage. (B) The analysis on the association between the risk score and Gleason score. (C–F) Kaplan-Meier curve analysis in the subgroups with different clinical characteristics in the testing dataset. (C) patients with T0-T2 stage; (D) patients with T3-T4 stage; (E) patients with Gleason score <=7; (F) patients with Gleason score >7.

