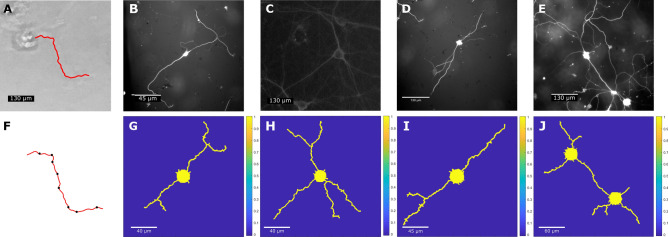
Figure 4.
Comparison of the phase field model results of neuron growth with experimental results based on extracellular attractive cue-guided growth. (A) Traced neurite (red line) from a neuron cell culture at 5 DIV. (F) Change points (black dots) found along the neurite tracing (red line) in (B) using CPT algorithm with of 0.05 and q of 2. (B–E) Experimental images of primary rat hippocampal neurons observed at 20 DIV. (G–J) Corresponding simulation results of phase field model using attractive cue-guided neuron growth on grid sizes of 443 Œ 443, 513 Œ 513, 483 × 483, and 483 Œ 483. One extracellular cue is placed at the boundary for each neurite. Bifurcation is achieved by adding more than one extracellular cue at the corresponding growth stage. The simulation results show a similar reproduction of the growth pattern. By measuring the soma diameter in experimental images with respect to their scale bars, we can evaluate scale bar units for neuron growth simulation results.

