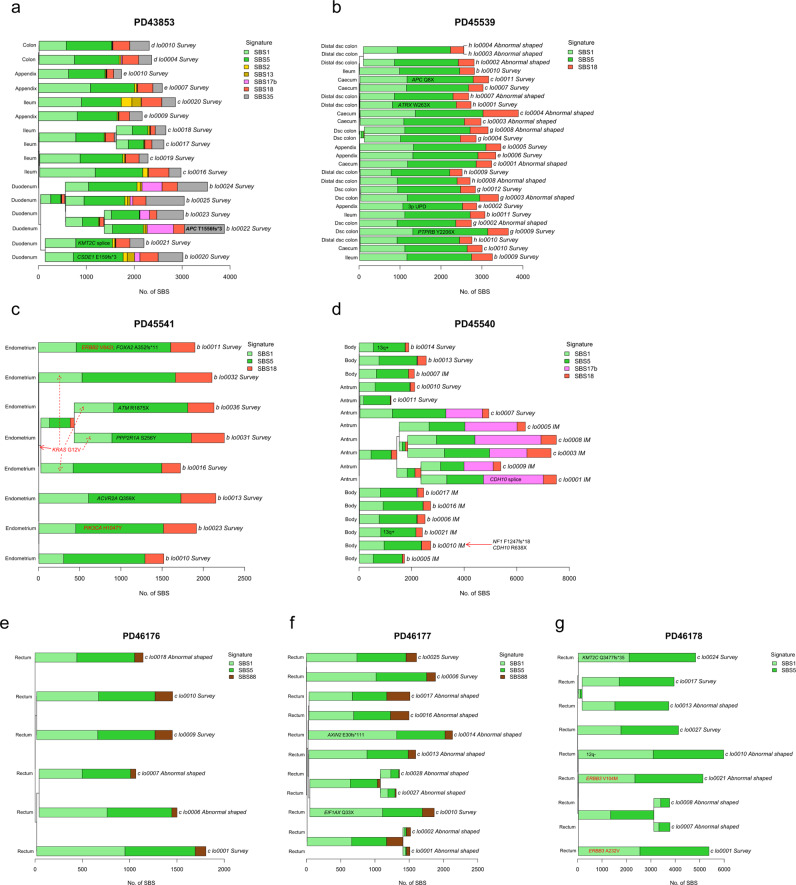
Fig. 3. SBS mutational signatures in the normal epithelium in LS patients.
Phylogenetic trees showing the clonal relationship between non-neoplastic crypts in 7 patients (a, b, e, f, g intestinal; c endometrial; d gastric). Branch lengths correspond to the number of SBS mutations. SBS mutational signatures are mapped onto tree branches. Each crypt is annotated with its identifier, crypt type, and tissue origin. Cancer driver mutations and copy number variants are labelled on the corresponding tree branch. Frameshift mutations at microsatellite regions (repeat length ≥ 5) are indicated in bold. Activating mutations of oncogenes are indicated in red. Inactivating mutations of tumour suppressors are indicated in black. c KRAS G12V was an early event and thus annotated on the common branch (red arrow) of the 4 crypts harbouring this mutation (dotted red arrows).

